Class 9 Maths Extra and Important Questions for Probability
Given below are the Class 9 Maths Extra Questions for Probability
a. Concepts questions
b. Calculation problems
c. Multiple choice questions
d. Long answer questions
e. Fill in the blanks
f. Link type comprehension
Link type comprehension
Question 1
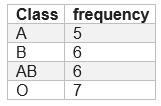
Twenty four people had a blood test and the results are shown below.
A , B , B , AB , AB , B , O , O , AB , O , B , A
AB , A , O , O , AB , B , O , A , AB , O , B , A (a) Construct a frequency distribution for the data. (b) If a person is selected randomly from the group of twenty four people, what is the probability that his/her blood type is not O? Solution (a)
Question 2
Over the past 100 working days, the number of defective bulbs produced by a machine is given in the following table:
a. The probability that tomorrow output will be defect free is .2
b. The probability that tomorrow output will have at least 1 defect is .8
c. The probability that tomorrow output will have more then 2 defect is .30
d. The probability that tomorrow output will have 3 defects is .28 Solution
a. True , P= $\frac {20}{100}=.2$
b. True , P= $\frac {(40+12+28)}{100}=.8$
c. False ,P= $\frac {28}{100}=.28$
d. True. P= $ \frac {28}{100}=.28$
Multiple choice Questions
Question 3
The probability of the events lies between
a. -1 ≤ p ≤ 1
b. 0 ≤ p ≤ 1
c. -1 ≤ p ≤ 0
d. -1 < p ≤ 1 Solution (b)
Question 4
Twelve bags of wheat flour, each marked 5 kg, actually contained the following weights of flour (in kg):
4.97 5.05 5.08 5.03 5.00 5.06 5.08 4.98 5.04 5.07 5.00 5.12
Find the probability that any of these bags chosen at random contains more than 5 kg
of flour
a. $\frac {1}{12}$
b. $\frac {7}{12}$
c. $\frac {2}{3}$
d. None of these Solution (c)
No of bags having weight more than 5 kg=8
Total =12
So $P= \frac {8}{12} = \frac {2}{3}$
Question 5
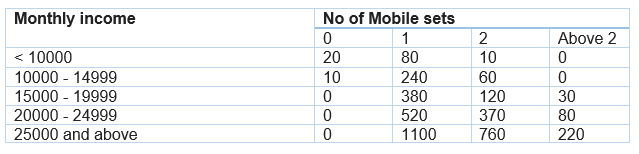
A company selected 4000 households at random and surveyed them to find out a relationship between income level and the number of mobile sets in a home. The information so obtained is listed in the following table:
Find the probability of a household earning Rs 10000 – Rs 14999 per year and having exactly one mobile set
a. $.06$
b. $.08$
c. $.04$
d. None of these Solution (a)
Around 240 household are there satisfying the condition
So $P= \frac {240}{4000}=.06$
Question 6
In the above question, Find the probability of a household earning more than 25000 per year and having exactly 2 mobile set
a. $.2$
b. $.19$
c. $.12$
d. $.3$ Solution (b)
Around 760 household are there satisfying the condition
So $P= \frac {760}{4000}=.19$
Question 7
In the above question, find the probability of a household earning more than 25000 per year and having 2 or more mobile set
a. $.245$
b. $.3$
c. $.1$
d. None of these Solution (a)
Around 980 household are there satisfying the condition
So $P= \frac {980}{4000}=.245$
Question 8
In the above question, Find the probability of a household having no mobile set at all?
a. $ \frac {3}{400}$
b. $ \frac {1}{400}$
c. $ \frac {1}{200}$
d. None of these Solution (a)
Around 30 household are there satisfying the condition
So $P= \frac {30}{4000}= \frac {3}{400}$
Question 9
In the above question, Find the probability of a household having 3 mobile set and having income less than 10000
a. .1
b. 0
c. .24
d. None of these Solution (b)
As no household exists like than, So probability is 0
Long Answer type
Question 10. A parent has collected data of number of school based on the monthly fees, so that he can choose the school for admission of his child. Data is as under:
If a school is selected at random, find the probability that the school is having –
minimum fees
maximum fees
fees less than 2900
fees at least Rs 1500
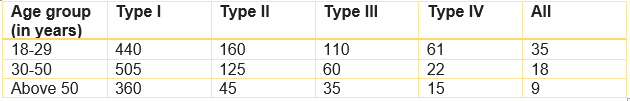
Question 11. A survey of 2000 people of different age groups was conduct to find out their preference n watching different types of movies.
Type I – family
Type II – comedy & family
Type III – romantic, comedy & family
Type IV – action, romantic, comedy & family
The data recorded was as follows –
Find the probability that person chosen at random is-
in 18-29 years of age and likes type II movies
above 50 years of age and likes all types of movies
in 30-50 years and likes type I movies.
Question 12. An insurance company selected 2000 drivers at random in a particular city to find a relationship between age and accidents. The data obtained are given in following table-
Age groups of no. of accidents
Drivers (in years) 0 1 2 3 more than 3
18-29 440 160 110 61 35
30-50 505 125 60 21 18
above 50 360 45 35 15 10
Find the probability:-
being 18-29 years of age and having exactly 3 accidents.
being 30-50 years of age and having one or more accidents in a year.
having no accidents in 1 year.
which value would you like to remember from data?
Question 13. Find the probability that a leap year, selected at random will have 53 Sundays Answer
A normal year(365 days) has 52 Mondays, 52 Tuesdays, 52 Wednesdays, 52 Thursdays, 52 Fridays, 52 Saturdays and 52 Sundays + 1 day( 7 X 52 +1) that could be anything depending upon the year under consideration. In addition to this, a leap year(366) has an extra day which might be a Monday or Tuesday or Wednesday...or Sunday.
So Now our question is reduced to finding the consecutive pairs of the year where one of them is a Sunday
Our sample space is S : {Monday-Tuesday, Tuesday-Wednesday, Wednesday-Thursday,..., Sunday-Monday}
Number of elements in S = n(S) = 7
Now Saturday-Sunday and Sunday-Monday satisfies our requirement(2)
probability of occurrence of 53 Sundays in leap = $ \frac {2}{7}$
Question 14. A coin is tossed 15 times and observed that 11 times head comes up. Find the probability that a tail comes up Answer
No. of heads = 11
no. of tails = 15-11
probability of tails = $ \frac {4}{15}$
Summary
This Probability class 9 extra questions is prepared keeping in mind the latest syllabus of CBSE . This has been designed in a way to improve the academic performance of the students. If you find mistakes , please do provide the feedback on the mail.