Welcome to Class 9 Maths chapter 14 statistics notes.The topics in this page are Introduction to Statistics,Presentation of Data,Measures of Central Tendency and graphs.This is according to CBSE and the NCERT textbook. If you like the study material, feel free to share the link as much as possible.
A systematic record of facts or different values of a quantity is called data.
Data recorded can be two types
1. Measurement data( Quantitative data): Data which has some numeric values like marks in the examination,age of the student in the class, Weight of the students in the class
2. Qualitative data: Data which can be group according to common properties like Gender of students in the class,Blood group of the students
Data can be of two types as per there source type- Primary data and Secondary data. Primary Data: The data collected by a researcher with a specific purpose in mind is called primary data. Secondary Data: The data gathered from a source where it already exists is called secondary data
Data variable can be many types
1. Discrete: If the data is present in certain values only like Blood group ,gender
2. Continuous:If the data can be present in any values from lower point to height points on the measurement scale like weight of the student,height of the student
Statistics
Statistics deals with collection, presentation, analysis and interpretation of numerical data.
Statistics Definition from 'Wikipedia'
Statistics is a mathematical body of science that pertains to the collection, analysis, interpretation or explanation, and presentation of data or as a branch of mathematics. Some consider statistics to be a distinct mathematical science rather than a branch of mathematics. While many scientific investigations make use of data, statistics is concerned with the use of data in the context of uncertainty and decision making in the face of uncertainty
Collection of data
The first step in any investigation is collection of data. The data may be collected for the whole population or for a sample only. Some real life example
1. Weights of students of our class
2. Production of wheat in the last 10 years in our country
3. Number of 1 BHK, 2BHK and 3BHK flats in our locality
4. Rainfall in our city in the last 10 years
5. Blood group of the students in the class
Presentation
It means
1.Arranging data in a order to study their salient features is called presentation of data
2. Data arranged in ascending or descending order is called arrayed data or an array
3. organize numerical information in the form of tables, graphs, and charts.
Analysis and interpretation
1. understand statistical techniques underlying decisions that affect our lives and well-being and
make informed decisions.
2. The process by which sense and meaning are made of the data gathered and applied to clients problem
Presentation of Data
We can divide data into two Forms in terms of Presentation
1. Ungrouped data
The data obtained in original form is called raw data or ungrouped data
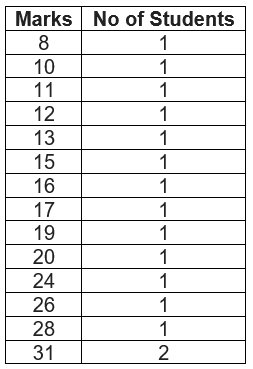
Example. The marks obtained obtained by 30 students in a class in a physics examination are given below;
20, 8, 31, 17, 40, 41, 28, 11, 41, 22, 13 ,16, 15, 19, 10, 32, 33, 22, 26, 31, 12, 31, 45, 49,54,52,53,57,56,58 This is ungrouped data.
Data arranged in ascending or descending order is called arrayed data or an array.
Arranging the marks out of 60 of 30 students in ascending order, we get the following array.
8, 10, 11,12, 13, 15, 16, 17, 19,20,22, 24, 26,28, 31,31,32, 33, 35, 40, 41,41, 45, 49,52,53,54,56,57,58
Range of the data is the difference between the maximum and the minimum values of the observations
So in this example range =57-8=51
We can put this in tabular format which is called a frequency distribution table
frequency distribution table is a Table that shows the frequency of different values in the given data
A frequency distribution table that shows the frequency of each individual value in the given data is called an ungrouped frequency distribution table.
2. Grouped data
The ungrouped data approach becomes very hard with large values of number.So we make groups of suitable size to put the data in a more condensed form and mention the frequency of each group. Such a table is called a grouped frequency distribution table.
A table that shows the frequency of groups of values in the given data is called a grouped frequency distribution table
The groupings used to group the values in given data are called classes or class-intervals. The number of values that each class contains is called the class size or class width. The lower value in a class is called the lower class limit. The higher value in a class is called the upper class limit.
Class mark of a class is the mid value of the two limits of that class.
A frequency distribution in which the upper limit of one class differs from the lower limit of the succeeding class is called an Inclusive or discontinuous Frequency Distribution.
A frequency distribution in which the upper limit of one class coincides from the lower limit of the succeeding class is called an exclusive or continuous Frequency Distribution
Lets us take previous example only Example The marks obtained obtained by 30 students in a class in a physics examination are given below;
20, 8, 31, 17, 40, 41, 28, 11, 41, 22, 13 ,16, 15, 19, 10, 32, 33, 22, 26, 31, 12, 31, 45, 49,54,52,53,57,56,58 Inclusive or discontinuous Frequency Distribution.
0-9
1
10-19
8
20-29
5
30-39
5
40-49
5
50 -59
6
In above examples the classes are discontinuous i.e 0-9,10-19 Exclusive or continuous Frequency Distribution
0-10
1
10-20
8
20-30
5
30-40
5
40-50
5
50 -60
6
In above examples the classes are continuous i.e 0-10,10-20
Graph’s
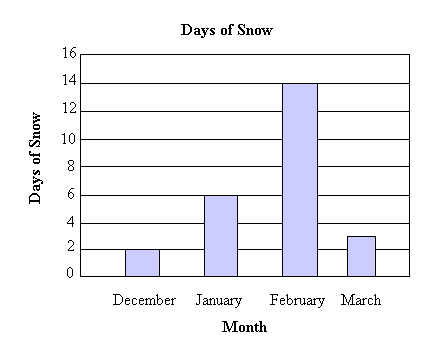
Bar Graph
A bar graph is a pictorial representation of data in which rectangular bars of uniform width are drawn with equal spacing between them on one axis, usually the x axis. The value of the variable is shown on the other axis that is the y axis.
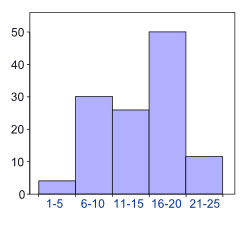
Histogram
A histogram is a set of adjacent rectangles whose areas are proportional to the frequencies of a given continuous frequency distribution
Measures of Central Tendency
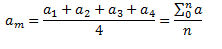
Mean
The mean value of a variable is defined as the sum of all the values of the variable divided by the number of values. Median
The median of a set of data values is the middle value of the data set when it has been arranged in ascending order. That is, from the smallest value to the highest value
Median is calculated as
Where n is the number of values in the data
If the number of values in the data set is even, then the median is the average of the two middle values. Mode
Mode of a statistical data is the value of that variable which has the maximum frequency.
How to Solve Mean,Median and Mode problem's
1. Arrange the data in ascending order from low value to high value
2.Create the frequency distribution table of the data
3. Calculate Mean,median and mode using it
Solved Examples
Question 1
The heights of 60 students, measured to the nearest centimetres. The values are shown below
161 150 154 165 168 161 154 162 150 151
162 164 171 165 158 154 156 172 160 170
153 159 161 170 162 165 166 168 165 164
154 152 153 156 158 162 160 161 173 166
161 159 162 167 168 159 158 153 154 159
162 158 161 167 169 154 156 151 154 159
(i) Represent the data given above by a grouped frequency distribution table, taking the class intervals as 160 - 165, 165 - 170, etc.
(ii) What can you conclude about their heights from the table? Solution
Grouped frequency distribution table for total students(60)
Height (cm)
No of students
150-155
15
155-160
12
160-165
16
165-170
12
170-175
5
We can see that 70% of the students is having height less than 165
Question 2
The following number of goals were scored by a Indian hockey team in a series of 10 matches:
2, 3, 4, 5, 0, 1, 3, 3, 4, 3
Find the mean, median and mode of these scores Solution
1. Arrange then in ascending order
0,1,2,3,3,3,3,4,4,5
2. Frequency distribution
Question 3
Three coins were tossed 30 times simultaneously. Each time the number of heads occurring was noted down as follows
0 1 2 2 1 2 3 1 3 0
1 3 1 1 2 2 0 1 2 1
3 0 0 1 1 2 3 2 2 0
Prepare a frequency distribution table for the data given above.
Solution
By observing the data given above, the required frequency distribution table can be constructed as follows.
Number of heads
Number of times (frequency)
0
6
1
10
2
9
3
5
Total
30
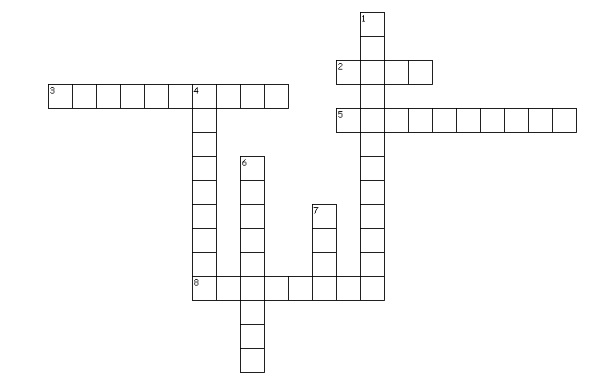
Crossword puzzle for Statistics Across
2. A systematic record of facts or different values of a quantity is called _____
3. It is frequency distribution in which the upper limit of one class coincides from the lower limit of the succeeding class
5. It deals with collection, presentation, analysis and interpretation of numerical data.
8. Term used when data is present in certain values only Down
1. Data which can be measured
4. it is the raw data
6. It is a frequency distribution in which the upper limit of one class differs from the lower limit of the succeeding class
7. Maximum frequency data
 Where n is the number of values in the data