Given below are the Class 9 Maths Worksheet for statistics
a. Concepts questions
b. Calculation problems
c. Multiple choice questions
d. Long answer questions
e. Fill in the blank's
Question 1.
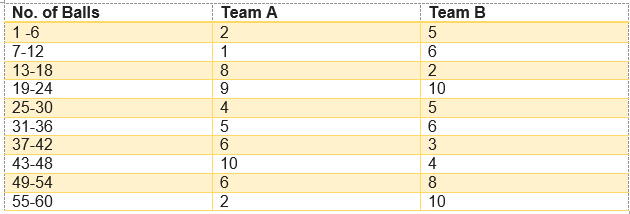
The runs scored by two teams A and B on first 60 balls in cricket match are given below:-
Represent the data of both teams on same graph by frequency polygon.
Question 2.
A random survey of no. of children of various age groups playing in a park was found as follows:-
Age (in years)
No. of Children
1-2
5
2-3
3
3-5
6
5-7
12
7-10
9
10-15
10
15-17
4
Draw a histogram to represent the data above.
Question 3.
Two sections of Class IX having 30 students each appeared for mathematics olympiad. The marks obtained by them are shown below:
46 31 74 68 42 54 14 61 83 48 37 26 8 64 57
93 72 53 59 38 16 88 75 56 46 66 45 61 54 27
27 44 63 58 43 81 64 67 36 49 50 76 38 47 55
77 62 53 40 71 60 58 45 42 34 46 40 59 42 29
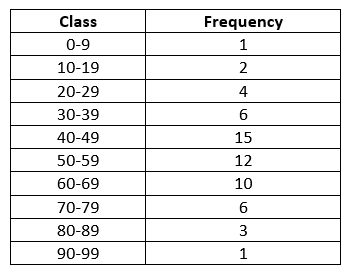
Construct a group frequency distribution of the data above using the classes 0-9, 10-19 etc., and hence find the number of students who secured more than 39 marks.
Answer
From the table above, we find that the number of students who secure more than 39
marks is (15+12 + 10 + 6 + 3 + 1), i.e., 47
Question 4.
Find the mode of 14, 25, 14, 28, 18, 17, 18, 14, 23, 22, 14, 18.
Answer
Mode is 14
Question 5.
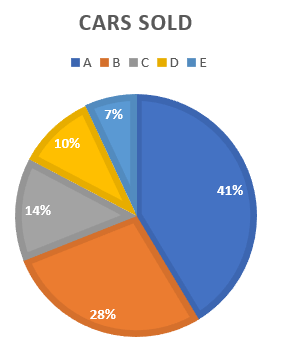
The following table shows the no. of X cars sold by five dealers in a particular month.
Dealer:
A
B
C
D
E
Cars sold
60
40
20
15
10
Draw a pictograph.
Answer
Question 6.
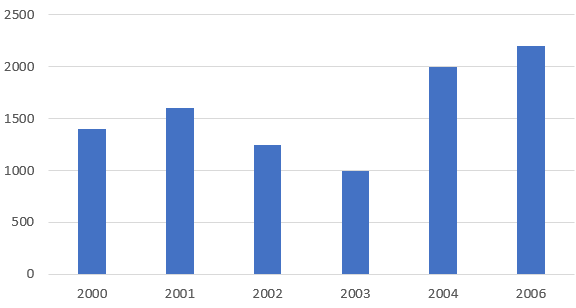
The following data gives the no. of students of Mumbai state who went abroad for study during some years-
Years:
2000
2001
2002
2003
2004
2006
No of students
1400
1600
1250
1000
2000
2200
Represent it with a bar graph.
Answer
br>
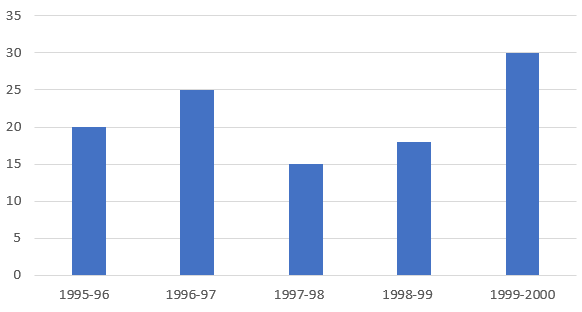
Question 7.
The following table shows the interest paid by a company (in lakhs):
Year
1995-96
1996-97
1997-98
1998-99
1999-2000
Interests
20
25
15
18
30
(in lakh of Rs)
Draw a bar graph to represent it.
Answer
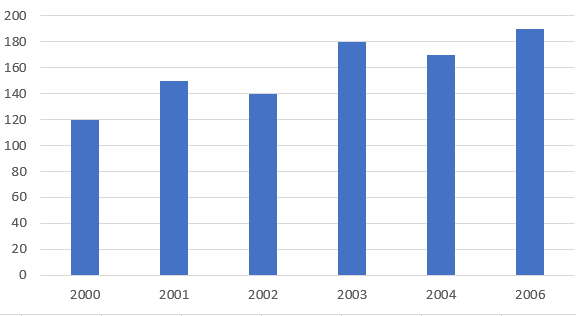
Question 8.
The following data gives the production of food grains for some years-
Years:
2000
2001
2002
2003
2004
2006
Production
120
150
140
180
170
190
(in 1000 tonnes)
Represent it with a bar graph.
Answer
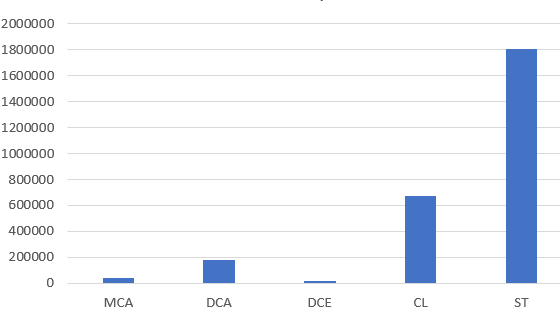
Question 9.
The following data gives the demand estimates of the Government of India, Department of Electronics for the personal in the computer Sector during the Eighth plan period (1990-95)
Qualifications:
MCA
DCA
DCE
CL
ST
Personal required
40600
181600
18600
670600
1802900
Represent it with a bar graph.
Indicate with help of bar graph the course where estimated requirement is least.
Answer
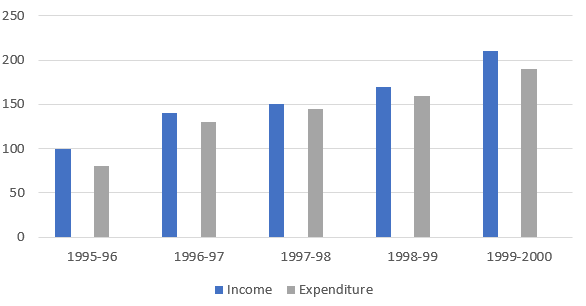
Question 10. The incomes and expenditure for 5 years of a family is given in a following data:
Years
1995-96
1996-97
1997-98
1998-99
1999-2000
Income
(Rs. in thou)
100
140
150
170
210
Expenditure
(Rs in thou)
80
130
145
160
190
Represent it with a bar graph.
Answer
Question 11.
The mean marks (out of 100) of boys and girls in an examination are 70 and 73, respectively. If the mean marks of all the students in that examination is 71, find the ratio of the number of boys to the number of girls.
Answer
let m and n be number of boys and girls respectively
Then total marks of boys and girls are 70m and 73n respectively
Total Mark of Students =70m + 73 n
Now
Mean = Total Marks/Total students
$71= \frac {70m + 73 n}{m+n}$
or
$71(m+n)=70m + 73 n$
$71(\frac {m}{n} + 1)= 70 \frac {m}{n} + 73$
$\frac {m}{n}=2$
Summary
This Class 9 Maths Worksheet for statistics with answers is prepared keeping in mind the latest syllabus of CBSE . This has been designed in a way to improve the academic performance of the students. If you find mistakes , please do provide the feedback on the mail.
 br>
br>