The wavy curve method is also known as the “sign-chart” method. It is a technique used in mathematics to solve inequalities, particularly those involving trigonometric, polynomial, and rational functions. It’s a graphical representation that helps us understand the nature of the function and the intervals where it’s positive or negative.
How wavy curve method works?
Identify critical points: These are the points where the function equals zero or is undefined. For a polynomial, these would be the roots. For a rational function, they would be the roots of the numerator (where the function is zero) and the roots of the denominator (where the function is undefined).
Polynomial would of the form
$f(x) = a_1 x + a_2 x^2 + ……..+a_n a^{n}$
Rational Function would be of the form
$g(x) = \frac {a_1 x + a_2 x^2 + ……..+a_n a^{n}}{b_1 x + b_2 x^2 + ……..+b_m a^{m}}$

We could convert them into these forms to get the critical points
$f(x) = (x-a)(x-b)…(x-n)$
$g(x) = \frac {(x-i_)(x-i_2)…(x-I_n)}{(x-j_1)(x-j_2)…(x-j_n)}$
Create a number line: Draw a number line and mark all the critical points. Zeros should be marked with dark circle and undefined values should be marked with while hold circle
Test interval of leftmost number: Check the value of f(x) for any real numbers greater than the leftmost number on the number line
Sketch the curve: Sketch the wavy curve starting from left to right from above the number line if the above step was positive and below the number line if the above was negative, passing through all the points
Important points.
- If the exponent of the factor is odd, it is called a sample point
- If the exponent of the factor is even, it is called a double point
If the point is the double point, the curve remains located on the same side and if the point is a sample point, the curve crosses the number line
Example
f(x) = (x-2)(x-3)(x-4)(x-5)
for x = 1, it is positive, so a wavy curve would be
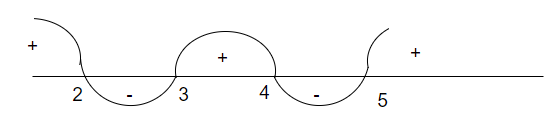
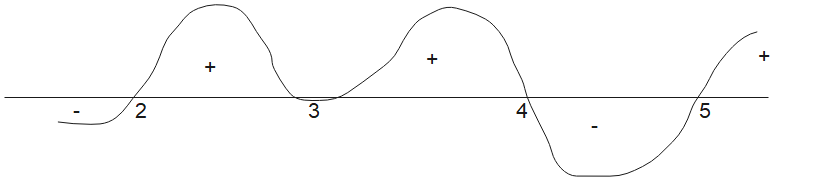
$f(x) = (x-2)(x-3)^2(x-4)(x-5)$
for x = 1, it is negative, Also we have a double point in this function, so wavy curve would be
Answer the question: Depending on what the question asks, use the sketch. For example, if you want to find where the function is positive, it would be the intervals where your sketch lies above the x-axis.
This method helps you to understand the behaviour of the function without needing to fully graph it or resort to a trial-and-error method for solving inequalities. Remember, though, that this technique gives an idea about the function’s behaviour but not its exact shape.
Examples
Solve the inequality $x^3 – 4x^2 + 4x < 0$.
Identify critical points: The roots of the inequality are the solutions to $x^3 – 4x^2 + 4x = 0$.This can be factored to $x(x – 2)^2 = 0$. Therefore, the critical points are x = 0 and x = 2.
Create a number line: Draw a number line and mark 0 and 2.
Test interval of left most number:The intervals are $(-\infty, 0)$, (0, 2), and $(2, \infty)$.Choose test points say -1
For x = -1: $(-1)^3 – 4(-1)^2 + 4(-1) = -1 – 4 – 4 = -9$, which is less than 0.
Sketch the curve: The curve is drawn below
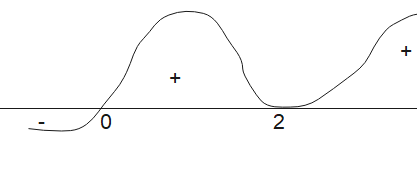
Based on the above signs, the curve is below the x-axis for the interval $(-\infty, 0)$, and above the x-axis for the intervals (0, 2) and $(2, \infty)$.
Answer the question: Since we want to find where the function is less than 0, the solution to the inequality $x^3 – 4x^2 + 4x < 0 $is x in $(-infty, 0)$.