Class 9 maths Statistics - NCERT Solutions Chapter 14 Ex 14.3
In this page we have Class 9 maths Statistics - NCERT Solutions Chapter 14 for
EXERCISE 14.3 . Hope you like them and do not forget to like , social share
and comment at the end of the page.
Chapter 14 Ex 14.3
Question 1
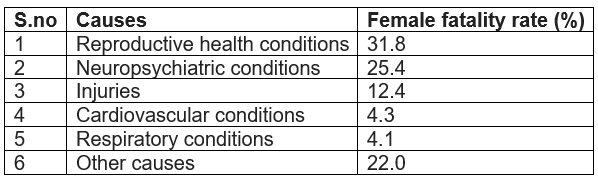
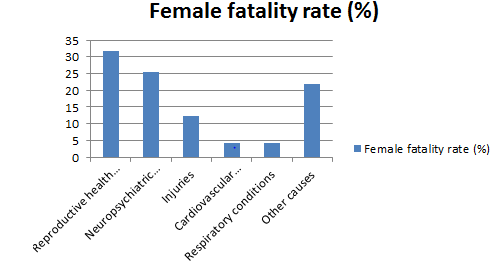
A survey conducted by an organization for the cause of illness and death among the women between the ages 15 - 44 (in years) worldwide, found the following figures (in %):
(i)Represent the information given above graphically.
(ii) Which condition is the major cause of women’s ill health and death worldwide?
(iii) Try to find out, with the help of your teacher, any two factors which play a major role in the cause in (ii) above being the major cause. Solution
Bar graph
Reproductive health conditions
Question 2
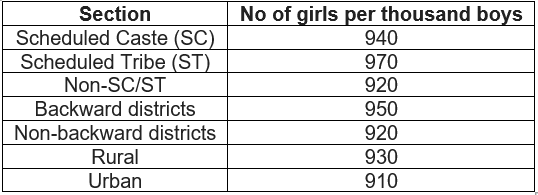
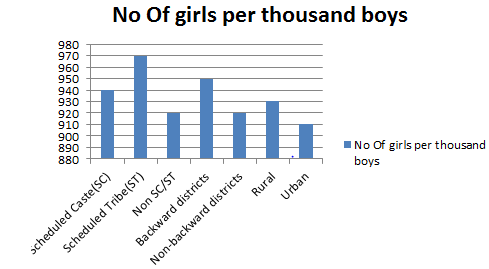
The following data on the number of girls (to the nearest ten) per thousand boys in different sections of Indian society is given below
(i) Represent the information above by a bar graph.
(ii) In the classroom discuss what conclusions can be arrived at from the graph Solution:
It can be observed that maximum number of girls per thousand boys (i.e., 970) is for ST and minimum number of girls per thousand boys (i.e., 910) is for urban.
Also, the number of girls per thousand boys is greater in rural areas than that in urban areas, backward districts than that in non-backward districts, SC and ST than that in non-SC/ST.
Question 3:
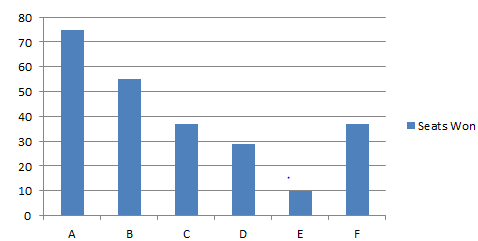
Given below are the seats won by different political parties in the polling outcome of a state assembly elections
(i) Draw a bar graph to represent the polling results.
(ii) Which political party won the maximum number of seats? Solution:
We may find that political party 'A' won maximum number of seats.
Question 4:
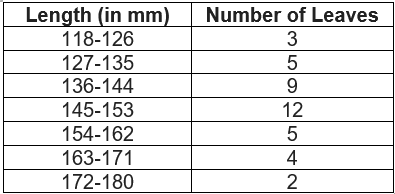
The length of 40 leaves of a plant are measured correct to one millimeter, and theObtained data is represented in the following table
(i) Draw a histogram to represent the given data. [Hint: First make the class intervals Continuous]
(ii) Is there any other suitable graphical representation for the same data?
(iii) Is it correct to conclude that the maximum number of leaves are 153 mm long? Why? Solution:
It can be observed that the length of leaves is represented in a discontinuous class interval having a difference of 1 in between them. Therefore, ½=.5 has to be added to each upper class limit and also have to subtract 0.5 from the lower class limits so as to make the class intervals continuous.
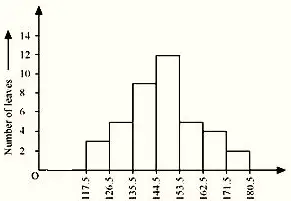
Taking the length of leaves on x-axis and the number of leaves on y-axis, the histogram of this information can be drawn as above.
Here, 1 unit on y-axis represents 2 leaves.
(ii) Other suitable graphical representation of this data is frequency polygon.
(iii) No, as maximum number of leaves (i.e., 12) has their length in between 144.5 mm and 153.5 mm. It is not necessary that all have their lengths as 153 mm
Question 5
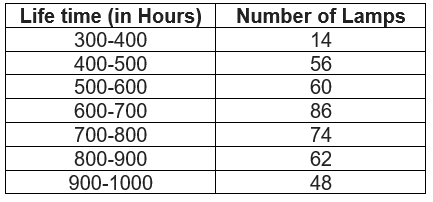
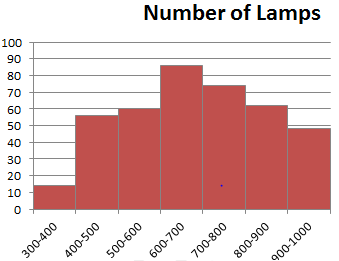
The following table gives the life times of neon lamps:
(i) Represent the given information with the help of a histogram.
(ii) How many lamps have a life time of more than 700 hours?
Solution:
(i)
(ii) Number of lamps having lifetime of more than 700 hours =74+62+48=184
Question 6
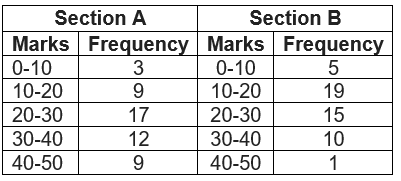
The following table gives the distribution of students of two sections according to the marks obtained by them:
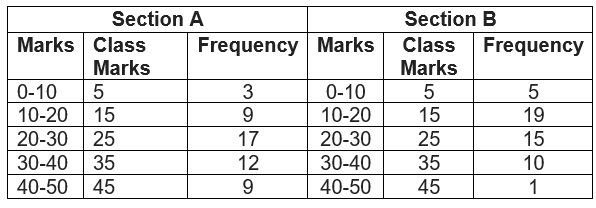
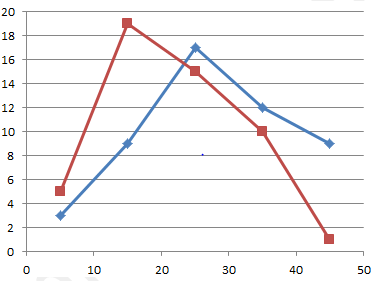
Represent the marks of the students of both the sections on the same graph by two frequency polygons. From the two polygons compare the performance of the two sections. Solution Class Marks can calculated as = (Lower Limit+ Upper limit)/2 Red line Represent Section B Blue line represent Section A
From the graph we can see performance of students of section 'A' is better than the students of section 'B' as for good marks.
Question 7:
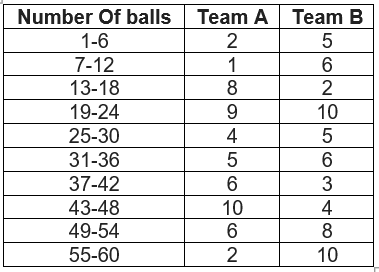
The runs scored by two teams A and B on the first 60 balls in a cricket match are given below
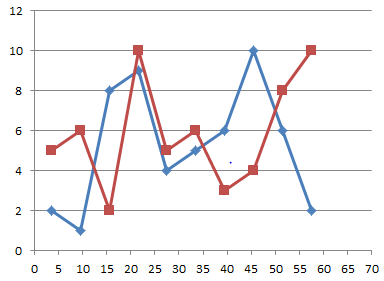
Represent the data of both the teams on the same graph by frequency polygons.
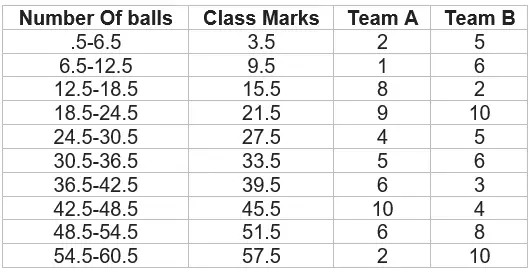
[Hint: First make the class intervals continuous.] Solution:
Question 8:
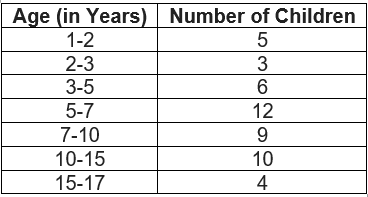
A random survey of the number of children of various age groups playing in a park was found as follows:
Draw a histogram to represent the data above.
Question 9:
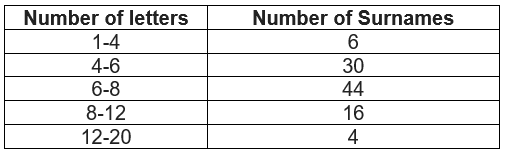
100 surnames were randomly picked up from a local telephone directory and a frequency distribution of the number of letters in the English alphabet in the surnames was found as follows:
Draw a histogram to depict the given information.
Write the class interval in which the maximum number of surnames lies
Summary
NCERT solutions for class 9 maths chapter 14 Ex 14.3 has been prepared by Expert with utmost care. If you find any mistake.Please do provide feedback on mail. You can download the solutions as PDF in the below Link also Download this assignment as pdf
This chapter 14 has total 4 Exercise 14.1 ,14.2 ,14.3 and 14.4. This is the third exercise in the chapter.