NCERT Solutions for Class 9th Maths: Chapter 14 Ex 14.2
In this page we have NCERT Solutions for Class 9th Maths: Chapter 14 Statistics for
EXERCISE 14.2 . Hope you like them and do not forget to like , social share
and comment at the end of the page.
Chapter 14 Ex 14.2
Question 1
The blood groups of 30 students of Class VIII are recorded as follows:
A, B, O, O, AB, O, A, O, B, A, O, B, A, O, O,
A, AB, O, A, A, O, O, AB, B, A, O, B, A, B, O.
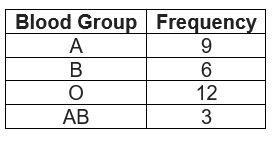
Represent this data in the form of a frequency distribution table. Which is the most common, and which is the rarest, blood group among these students? Solution
The number of students who have a certain type of blood group is called frequency of the blood group
The below Frequency distribution is prepared
We can clearly see from the frequency distribution table that blood group AB is the rarest and blood group O is the most common.
Question 2
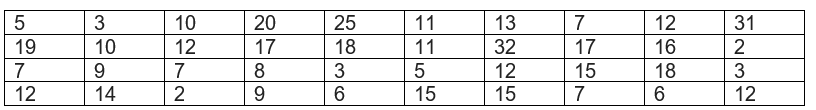
The distance (in km) of 40 engineers from their residence to their place of work were found as follows:
Construct a grouped frequency distribution table with class size 5 for the data given above taking the first interval as 0 - 5 (5 not included). What main feature do you observe from this tabular representation? Solution:
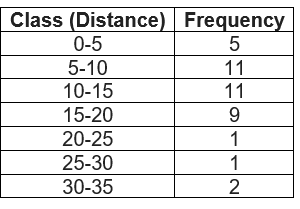
It is given that a grouped frequency distribution table of class size 5 has to be constructed. Therefore, the class intervals will be 0 − 5, 5 − 10, 10 − 15, 15 −20…
By observing the data given as above, a grouped frequency distribution table can be constructed as follows.
It can be observed that there are very few engineers whose homes are at more than or equal to 20 km distance from their work place. Most of the engineers have their workplace up to 15 km distance from their homes.
Question 3:
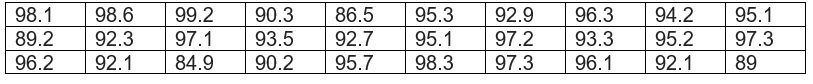
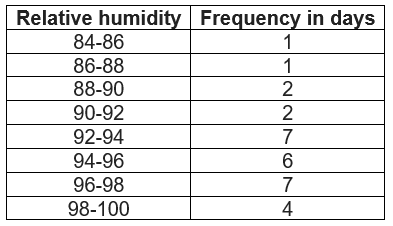
The relative humidity (in %) of a certain city for a month of 30 days was as follows
(i)Construct a grouped frequency distribution table with classes
84 - 86, 86 - 88
(ii)Which month or season do you think this data is about?
(iii)What is the range of this data? Solution:
Class intervals will be as follows 84 - 86, 86 - 88, and 88 - 90... ...
(ii) Since relative humidity is high so the data must be of a month of rainy season.
(iii) Range of data = maximum value - minimum value
= 99.2 - 84.9
= 14.3
Question 4:
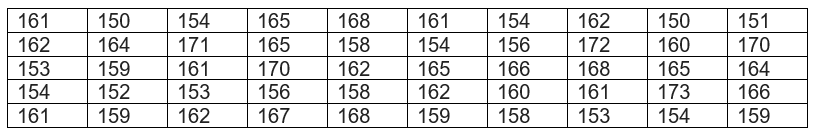
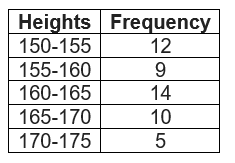
The heights of 50 students, measured to the nearest centimeters, have been found to be as follows:
(i) Represent the data given above by a grouped frequency distribution table, taking the class intervals as 160 - 165, 165 - 170, etc.
(ii) What can you conclude bout their heights from the table? Solution:
Class intervals will be as follows 160 - 165, 165 - 170, etc.
It is clear from the table, out of 50 students, 35 are below 165 cm. So 50%of the students are below 165cm
Question 5
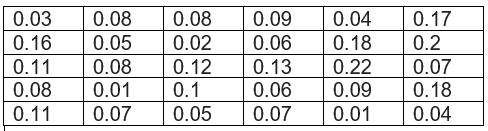
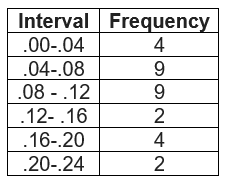
A study was conducted to find out the concentration of sulphur dioxide in the air in Parts per million (ppm) of a certain city. The data obtained for 30 days is as follows
(i) Make a grouped frequency distribution table for this data with class intervals as 0.00 - 0.04, 0.04 - 0.08, and so on.
(ii) For how many days, was the concentration of sulphur dioxide more than 0.11 parts per million? Solution
(i)Frequency distribution
(ii)The concentration of sulphur dioxide was more than 0.11 parts per million for 8 days.
Question 6
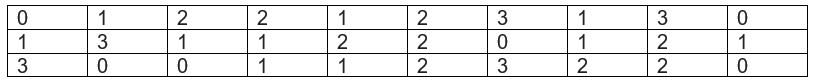
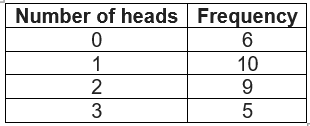
Three coins were tossed 30 times simultaneously. Each time the number of heads occurring was noted down as follows
Prepare a frequency distribution table for the data given above. Solution
Frequency table
Question 7:
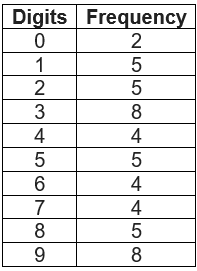
The value of π up to50 decimal places is given below:
3.14159265358979323846264338327950288419716939937510
(i) Make a frequency distribution of the digits from 0 to 9 after the decimal point.
(ii) What are the most and the least frequently occurring digits? Solution:
(i)
(ii) From the above table the least frequency is 2 of digit 0, and the maximum frequency is 8 of digit 3 and 9. So, the most frequently occurring digits are 3 and 9 and the least occurring digit is 0.
Question 8:
Thirty children were asked about the number of hours they watched TV programmes in the previous week. The results were found as follows:
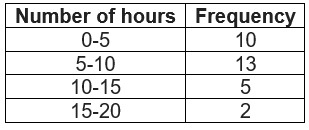
(i) Make a grouped frequency distribution table for this data, taking class width 5 and one of the class intervals as 5 - 10.
(ii) How many children watched television for 15 or more hours a week? Solution:
(i) Frequency table
(ii) 2 children watched television for 15 or more hours per week.
Question 9:
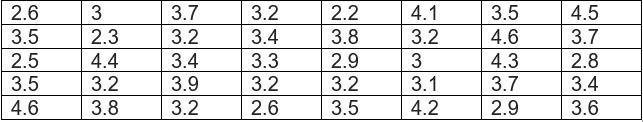
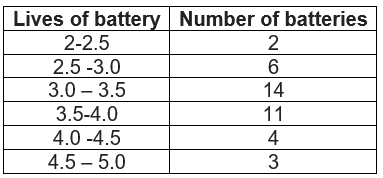
A company manufactures car batteries of a particular type. The lives (in years) of 40 such batteries were recorded as follows:
Construct a grouped frequency distribution table for this data, using class intervals of size 0.5 starting from the intervals 2 − 2.5. Solution:
Frequency distribution
Summary
NCERT solutions for class 9 maths chapter 14 Ex 14.2 has been prepared by Expert with utmost care. If you find any mistake.Please do provide feedback on mail. You can download the solutions as PDF in the below Link also Download this assignment as pdf
This chapter 14 has total 4 Exercise 14.1 ,14.2 ,14.3 and 14.4. This is the second exercise in the chapter.