Two readings from one graph — the slope gives you acceleration, and the shaded area gives you displacement. Master this and the kinematic equations practically write themselves. From NCERT Chapter 4 (Exploration edition) Class 9 Science. Aligned with CBSE syllabus 2026-27.

Q. Why do we need a velocity-time graph when we already have a position-time graph?
The position-time graph shows where an object is at each moment. But it requires you to calculate slopes to find velocity, and extracting acceleration from it involves even more work. The velocity-time graph puts velocity directly on the y-axis — making acceleration readable directly as the slope, and displacement readable as the enclosed area. It is more powerful for understanding how motion evolves.
A velocity-time graph (also called a speed-time graph for scalar situations) is a graph in which:
Each point $(t, v)$ tells you: "At time $t$, the object had velocity $v$." The shape of the graph encodes the entire history of how velocity changed — and from that, you can extract both acceleration and displacement.
If the velocity does not change with time, the graph is a horizontal straight line (parallel to the x-axis). The slope is zero, meaning acceleration is zero. This represents uniform motion — the object moves at the same velocity throughout.
Example (Fig. 4.17a): An object moving at a constant 20 m s⁻¹ — the graph is a horizontal line at $v = 20$ m s⁻¹ for all time values. Acceleration = 0.
If velocity increases uniformly with time, the graph is a straight line tilting upward (positive slope). This represents uniform acceleration — velocity increases by equal amounts in equal time intervals.
NCERT Table 4.5 (Accelerating vehicle):
| Time (s) | 0 | 10 | 20 | 30 | 40 |
|---|---|---|---|---|---|
| Velocity (m s⁻¹) | 5 | 10 | 15 | 20 | 25 |
Velocity increases by 5 m s⁻¹ every 10 s — equal increments. The v-t graph is a straight line with positive slope. Acceleration = 0.5 m s⁻².
If velocity decreases uniformly, the graph is a straight line tilting downward (negative slope). This represents uniform deceleration.
NCERT Table 4.6 (Decelerating vehicle):
| Time (s) | 0 | 10 | 20 | 30 | 40 |
|---|---|---|---|---|---|
| Velocity (m s⁻¹) | 25 | 20 | 15 | 10 | 5 |
Velocity decreases by 5 m s⁻¹ every 10 s. The graph slopes downward. Acceleration = −0.5 m s⁻² (retardation).
Q. How do we calculate acceleration from a velocity-time graph?
Just as the slope of a position-time graph gives velocity, the slope of a velocity-time graph gives acceleration. This follows directly from the definition:
Where $BC$ is the vertical change (change in velocity) and $CA$ is the horizontal change (change in time) of the right-angled triangle formed on the graph.
From the Table 4.5 data: choose points $(t_1 = 10 \text{ s},\, v_1 = 10 \text{ m s}^{-1})$ and $(t_2 = 20 \text{ s},\, v_2 = 15 \text{ m s}^{-1})$:
$$a = \frac{15 - 10}{20 - 10} = \frac{5}{10} = +0.5 \text{ m s}^{-2}$$Positive acceleration — velocity is increasing.
From the Table 4.6 data: choose points $(t_1 = 10 \text{ s},\, v_1 = 20 \text{ m s}^{-1})$ and $(t_2 = 20 \text{ s},\, v_2 = 15 \text{ m s}^{-1})$:
$$a = \frac{15 - 20}{20 - 10} = \frac{-5}{10} = -0.5 \text{ m s}^{-2}$$Negative acceleration (retardation) — velocity is decreasing.
Acceleration is defined as change in velocity ÷ change in time. On a v-t graph, the y-axis is velocity and the x-axis is time. The slope = (change in y)/(change in x) = (change in velocity)/(change in time) = acceleration. The geometry of the graph directly encodes the physics of the definition. This is why physicists love graphs — the equations become shapes you can see.
Q. How can the area of a shape on a graph give us displacement?
This is one of the most elegant ideas in Class 9 physics. Consider: displacement = velocity × time (for constant velocity). On a v-t graph, velocity is the height and time is the base of a rectangle. So displacement = area of the rectangle. This extends to non-uniform motion too.
Displacement = area enclosed between the velocity-time graph and the time-axis during the time interval of interest.
The area is calculated geometrically using the shapes formed:
Object moving at constant velocity $v = 20$ m s⁻¹ for $t = 6$ s. The v-t graph is a horizontal line at 20 m s⁻¹. The area enclosed is a rectangle:
$$s = v \times t = 20 \text{ m s}^{-1} \times 6 \text{ s} = 120 \text{ m}$$Area = length × width = 6 × 20 = 120 m. This equals the displacement.
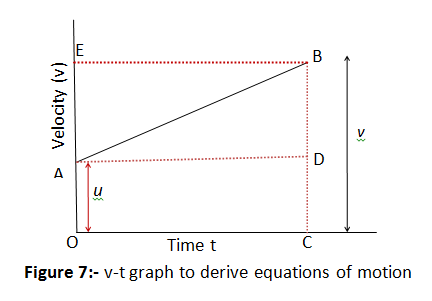
Using NCERT Fig. 4.18b: an object accelerates from $u = 5$ m s⁻¹ at $t = 10$ s to $v = 10$ m s⁻¹ at $t = 20$ s.
The area between $t = 10$ s and $t = 20$ s is a trapezium, which we split into:
For an object accelerating from initial velocity $u$ to final velocity $v$ in time $t$:
$$s = \frac{1}{2}(u + v) \times t$$This is the area formula for a trapezium: ½ × (sum of parallel sides) × height. It is also one of the kinematic equations!
If part of the v-t graph is below the x-axis, it means the object is moving in the negative direction (opposite to the chosen positive direction). The area below the x-axis represents displacement in the negative direction. When calculating net displacement, subtract this area from the area above the x-axis. This is an important concept for Class 11 — for Class 9, NCERT keeps velocity non-negative.
The area calculations on a velocity-time graph are not just graphical tricks — they are the geometric foundation of the kinematic equations of motion.
| Graph Result | Equation it Gives |
|---|---|
| Slope = acceleration → $a = (v-u)/t$ | v = u + at (Eq. 4.4a) |
| Area of trapezium = displacement → $s = \frac{1}{2}(u+v)t$ | Substitute Eq.1 into this → s = ut + ½at² (Eq. 4.4b) |
| Eliminate $t$ from both equations above | v² = u² + 2as (Eq. 4.4c) |
For the full derivations of all three kinematic equations with step-by-step algebra, visit: Kinematic Equations — Class 9 →
| What you want to know | How to read it from the graph |
|---|---|
| Velocity at any instant | Read y-value at that time ✓ |
| Acceleration | Calculate slope = (Δv)/(Δt) ✓ |
| Displacement | Calculate area under graph ✓ |
| Whether motion is uniform | Horizontal line (zero slope) ✓ |
| Whether uniformly accelerated | Straight line with non-zero slope ✓ |
| Retardation | Negative slope (line tilts down) ✓ |
| Parameter | Position-Time Graph (p-t) | Velocity-Time Graph (v-t) |
|---|---|---|
| Y-axis | Position (m) | Velocity (m s⁻¹) |
| X-axis | Time (s) | Time (s) |
| Slope gives | Velocity | Acceleration |
| Area gives | Not directly useful | Displacement |
| Horizontal line means | Object at rest (v = 0) | Uniform motion (a = 0) |
| Straight line (non-horiz.) means | Uniform motion | Uniform acceleration |
| Curve means | Non-uniform motion (acceleration) | Non-uniform acceleration |
| Uniform motion looks like | Straight line through origin | Horizontal line |
A cyclist travels at 10 m s⁻¹ for 20 s, then uniformly decelerates to rest in 10 s. Find: (a) acceleration in each phase, (b) total displacement.
Phase 1 (0 to 20 s): Constant velocity = 10 m s⁻¹
Slope = 0 → Acceleration = 0
Displacement = Area of rectangle = 10 m s⁻¹ × 20 s = 200 m
Phase 2 (20 s to 30 s): Velocity decreases from 10 to 0 m s⁻¹
$$a = \frac{0 - 10}{30 - 20} = \frac{-10}{10} = \mathbf{-1 \text{ m s}^{-2}} \text{ (retardation)}$$Displacement = Area of triangle = ½ × 10 s × 10 m s⁻¹ = 50 m
Total displacement = 200 + 50 = 250 m
(Also equals total distance, since motion is in one direction only.)
A car starts from rest, accelerates uniformly to 20 m s⁻¹ in 10 s, maintains this speed for 20 s, then brakes uniformly to rest in 5 s. Draw the v-t graph and find: (a) acceleration in each phase, (b) total distance covered.
Phase 1 (0 to 10 s): Acceleration from 0 to 20 m s⁻¹
$$a_1 = \frac{20 - 0}{10} = \mathbf{+2 \text{ m s}^{-2}}$$Displacement = Area of triangle = ½ × 10 × 20 = 100 m
Phase 2 (10 s to 30 s): Constant velocity = 20 m s⁻¹
$a_2$ = 0
Displacement = Area of rectangle = 20 × 20 = 400 m
Phase 3 (30 s to 35 s): Braking from 20 to 0 m s⁻¹
$$a_3 = \frac{0 - 20}{5} = \mathbf{-4 \text{ m s}^{-2}}$$Displacement = Area of triangle = ½ × 5 × 20 = 50 m
Total displacement = 100 + 400 + 50 = 550 m
The v-t graph has: rising line → horizontal line → falling line (a trapezoid + triangle shape overall).
Q1. A velocity-time graph shows a straight line starting at 8 m s⁻¹ (at $t=0$) and ending at 8 m s⁻¹ (at $t=10$ s). What is the acceleration? What is the displacement?
Slope = (8 − 8)/(10 − 0) = 0. Acceleration = 0 (uniform motion). Displacement = area of rectangle = 8 × 10 = 80 m.
Q2. A v-t graph is a straight line from (0, 0) to (5 s, 20 m s⁻¹). Find: (a) acceleration and (b) displacement.
(a) Slope = (20 − 0)/(5 − 0) = 4 m s⁻²
(b) Area = triangle = ½ × 5 × 20 = 50 m
Q3. The v-t graph of an object is a straight line from $(0, 30 \text{ m s}^{-1})$ to $(10 \text{ s}, 0)$. Describe the motion. Find the acceleration and distance covered.
The object decelerates uniformly from 30 m s⁻¹ to rest in 10 s (retardation).
Acceleration = (0 − 30)/10 = −3 m s⁻²
Distance = area of triangle = ½ × 10 × 30 = 150 m
Q4. On a v-t graph, object A has slope 3 m s⁻² and object B has slope −2 m s⁻². Which is accelerating and which is decelerating?
A (positive slope = +3 m s⁻²) is accelerating — velocity increasing. B (negative slope = −2 m s⁻²) is decelerating (retardation) — velocity decreasing.
N1. A bus accelerates from 5 m s⁻¹ to 15 m s⁻¹ in 10 s. Using the v-t graph (trapezium method), find the displacement.
Rectangle: 5 m s⁻¹ × 10 s = 50 m
Triangle: ½ × 10 s × (15 − 5) m s⁻¹ = ½ × 10 × 10 = 50 m
Total displacement = 50 + 50 = 100 m
Verify using trapezium formula: $s = \frac{1}{2}(u+v)t = \frac{1}{2}(5+15) \times 10 = 100$ m ✓
N2. An object moves at 12 m s⁻¹ for 5 s then decelerates uniformly to rest in 4 s. Find the total distance covered.
Phase 1 (rectangle): 12 × 5 = 60 m
Phase 2 (triangle): ½ × 4 × 12 = 24 m
Total distance = 60 + 24 = 84 m
N3. A train starts from rest and accelerates at 1.5 m s⁻² for 20 s. What distance does it cover? Also find the final velocity.
Final velocity: $v = u + at = 0 + 1.5 \times 20 = 30$ m s⁻¹
Displacement (triangle area) = ½ × 20 × 30 = 300 m
Verify: $s = ut + \frac{1}{2}at^2 = 0 + \frac{1}{2}(1.5)(400) = 300$ m ✓