Here in this post ,we will check out how to draw the graph of sec inverse sec x i.e
$f(x) = sec^{-1} sec (x)$
As $sec (2\pi +x ) = sec x$
This is a periodic function with period $2\pi$
Also x cannot take values like $\frac {2n+1}{2} \pi$ as undefined
We know by definition
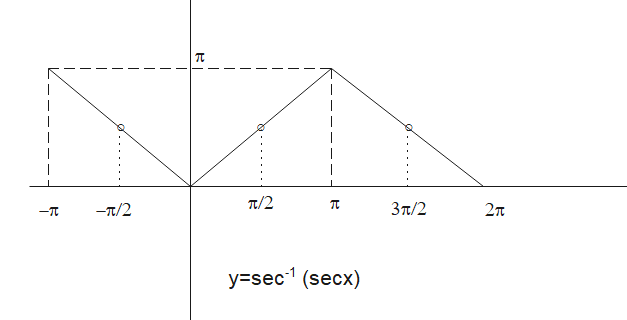
$f(x) = sec^{-1} sec (x) = x $ if $x \in [0, \pi] – {\pi/2}$
Lets check out the other values
if $x \in (-\pi, 0)$ but $ x \ne – \pi/2$
$-\pi \leq x \leq 0 $
Taking negative
$ 0< -x \leq \pi $
Also $sec ( -x) = sec x$
So $f(x) = sec^{-1} sec (x) = sec^{-1} sec (-x )= -x $
if $x \in (\pi, 2 \pi]$ but $ x \ne 3 \pi/2$
$\pi < x \leq 2\pi $
Taking negative
$-2\pi \leq -x < -\pi $
Adding $2\pi$
$0 \leq 2 \pi -x < \pi $
Also $sec (2\pi -x) = sec x$
So $f(x) = sec^{-1} sec (x) = sec^{-1} sec (2 \pi – x)= 2 \pi -x $
Therefore the graph will be