Here in this post ,we will check out how to draw the graph of sin inverse sin x i.e
$f(x) = sin^{-1} sin (x)$
We know by definition
$f(x) = sin^{-1} sin (x) = x $ if $x \in [-\pi/2, \pi/2]$
Lets check out the other values
if $x \in (\pi/2, 3\pi/2]$
$\pi/2 < x \leq 3\pi/2$
$- 3\pi/2 \leq -x < -\pi/2$
$\pi – 3\pi/2 \leq \pi -x < \pi – \pi/2$
$-\pi/2 \leq \pi -x < \pi/2$
Now $Sin(\pi -x) =sinx$
So $f(x) = sin^{-1} sin (x) = sin^{-1} sin (\pi -x)= \pi -x$
if $x \in (3\pi/2, 2\pi]$
$3\pi/2 < x \leq 2\pi$
$3\pi/2 -2 \pi < x- 2 \pi < 0$
$-\pi/2 < x- 2 \pi < 0$
Now $sin (2\pi -x) = -sin(x)$
or $sin(x) = sin (x -2 \pi)$
So $f(x) = sin^{-1} sin (x) = sin^{-1} sin (x -2 \pi)= x- 2\pi$
Therefore the graph will be
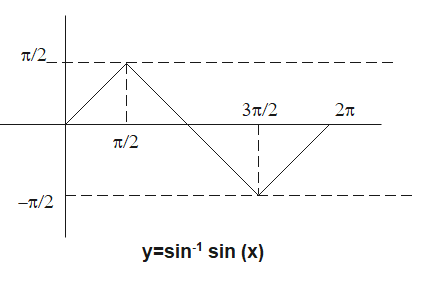
Here f(x) is a periodic function with period $2 \pi$, So same graph will be repeated for all the $2 \pi$ intervals
