In this article learn about the what is graph in physics and how to plot a basics of graphs in physics. Here you will learn about
- Why we need graphs
- What are graphs and
- How to plot graphs
After reading this article students would be able to define graphs and plot graphs using data on dependent and independent variables.
Let us now start with why we need graphs. We need graphs in physics because a graph is a very powerful method of presenting the information.
We can use both tables and graphs to represent the same information but graphs are a lot easier to read and interpret information than tables. Having established the need for graphs let us now define what is a graph.
What is graph in physics?
A graph is a line straight or curved that shows relation between two quantities out of which one varies as a result of change in other.
To make it clear let us consider we have two variables x and y where,
\(y=2x\)
The variable that is made to alter or change is called the independent variable. Here in our case x is an independent variable. Another variable that varies as a result of the change in the independent variable is called the dependent variable.
Here \(y\) is the dependent variable whose value changes with change in the value of \(x\).
This relation between the independent variable and the dependent variable can be shown by means of a graph.
Plotting a basic graph in physics

We already know that a graph is plotted to display the relationship between two quantities. To understand how a graph can be plotted, consider a car that is moving along a straight line. The distance moved by car every 6 minutes is given in this table.
| Time (in minutes | Distance (in seconds) |
| 0 | 0 |
| 6 | 10 |
| 12 | 20 |
| 18 | 30 |
| 24 | 40 |
| 30 | 50 |
| 36 | 60 |
let us now use the example of the above table and start looking at the steps involved in plotting a graph. Before starting it is important to note that here time t is the independent quantity and distance traveled depends on it.
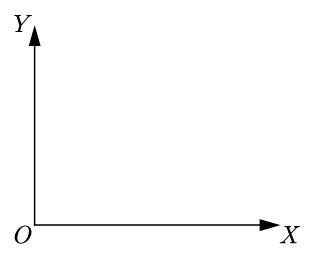
Step 1: Choosing the axes
Step 1 in plotting the graph is Choosing the axes. In this step first, mark the axis by drawing two perpendicular lines crossing each other at a point. Now mark the x-axis and y-axis.
We will take time along the x-axis because generally independent variables are taken along the x-axis. We will take distance which is the dependent variable along the y-axis. So the line OX represents time and line OY represents distance. These lines OX and OY are named after the quantities they represent.
Step 2: Choose the scale
In our second step, we would choose the scale. We have to choose the scale because the size of the paper on which the graph is drawn is limited. Values are marked at equal distances on the available length of the axis. You have to do it in such a way that all the values of the quantity represented on the axis can be accommodated in the available length.
Step 3: Plotting the points
In the third step, we would be plotting the points. Now each set of values of the two quantities is represented by a point on the graph. For example, the set 6 minutes and 10 kilometers is represented by point A on the graph. To get this point we mark 6 minutes on the x-axis and draw a perpendicular at the point on the x-axis. Similarly, locate 10 kilometers on the y-axis and draw a perpendicular on the y-axis at the point.
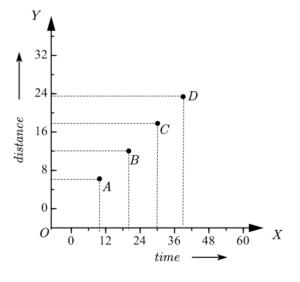
The point of intersection of these perpendiculars is point A. In this way, we will mark all the information given in the table on the graph.
Step 4: Joining the points
Our fourth step would be joining the points. Once all these points corresponding to available information in the table are plotted they are joined by a smooth curve to get the graph.
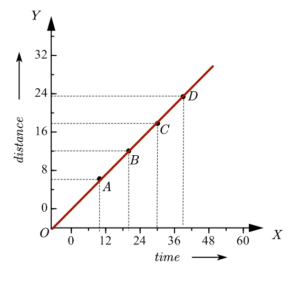
Here, in this case, we get a straight line that represents a uniform motion. I think now you have an idea about the basics of the graph and how to plot them.
So if you have knowledge of how distance varies with time for any object you should be able to plot a distance-time graph or position-time graph. Similarly, you can also plot the speed-time graph using this procedure. So, we can easily plot motion of object with the help of these steps.
Related Articles
- Further learn about motion graphs at http://hyperphysics.phy-astr.gsu.edu/hbase/Mechanics/motgraph.html
- More about graphs in physics: https://www.slideshare.net/simonandisa/graphs-in-physics
Wonderful, but can i get.labe here,?
It helped me alot
glad to hear that it helped.