This article is about the position-time graph. Before going further into details of the topic let us first understand how to draw these graphs. To draw graphs in x-y- plane
- The Independent variable is always taken on the x-axis.
- We plot the dependent variable on the y-axis.
- The dependent variable is dependent on the independent variable through some function. Know more about Functions in Maths
Let us observe the case of Kinematic equations for uniformly accelerated Motion. Time is our fundamental independent variable and position is a dependent variable. Along with position, displacement, velocity, and acceleration are also dependent variables. There are three basic types of motion graphs
1. Position-Time Graph (x-t graph)
2. Velocity-Time Graph (v-t graph)
3. Acceleration-Time Graph

In this article, we will only learn about Position-Time Graph.
What is a position-time graph?
It is a graph where the instantaneous position \(x\) of a particle is plotted on the y-axis and the time \(t\) on the x-axis as shown below in the figure:
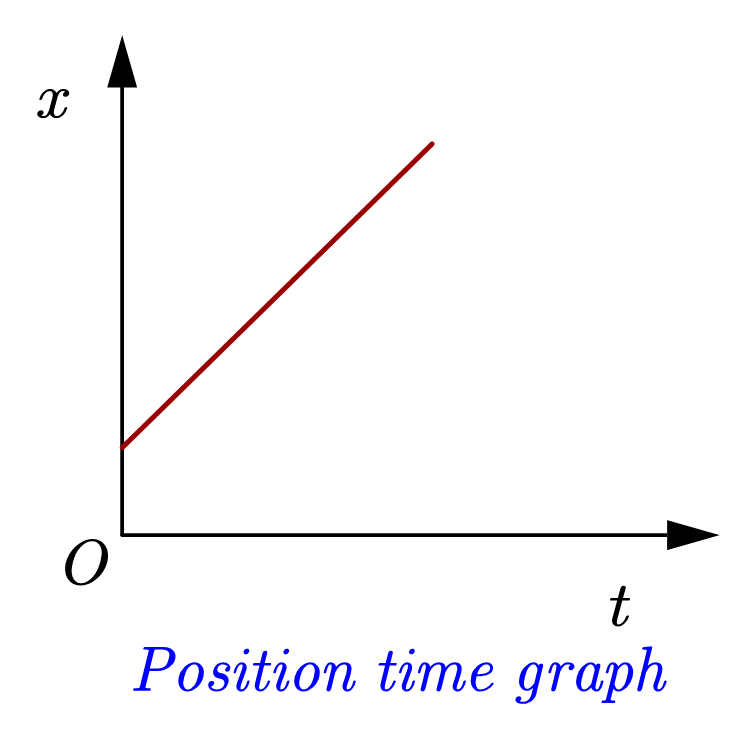
Position vs time graph for uniform motion
- When an object is in uniform motion it covers equal distance in equal intervals of time.
- x-t for an object in uniform rectilinear motion is a straight line inclined to the time axis.
Position vs time graph slope for uniform motion
Position vs time graph’s slope gives the velocity of the object. To find the slope of position vs time graph consider the figure given below

From this figure we can see that at time \(t=0\) object is at \(x_0\), at time \(t=t_1\) object is at \(x_1\) and at time \(t=t_2\) object is at \(x_2\). Here \(theta\) is the angle which inclined straight line i.e., the x-t plot makes with the x-axis.
Position vs time graph slope = slope of line AB
\(= \tan \theta = \frac{QR}{PR} = \frac{x_2 – x_1}{t_2 – t_1} \)
\(=\frac{Displacement}{time}=velocity\,\,(v)\)
Hence Position vs time graph slope gives the velocity of the object.
x-t graph for uniformly accelerated motion
Position time relation for uniformly accelerated motion along a straight line is
\[x=x_0+v_0 t+\frac{1}{2}t^2\]
dependence of \(x\) on \(t^2\) shows that it is a quadratic equation or quadratic function of \(t\). So, the position-time graph for uniform accelerated motion is a parabola as shown below in the figure.
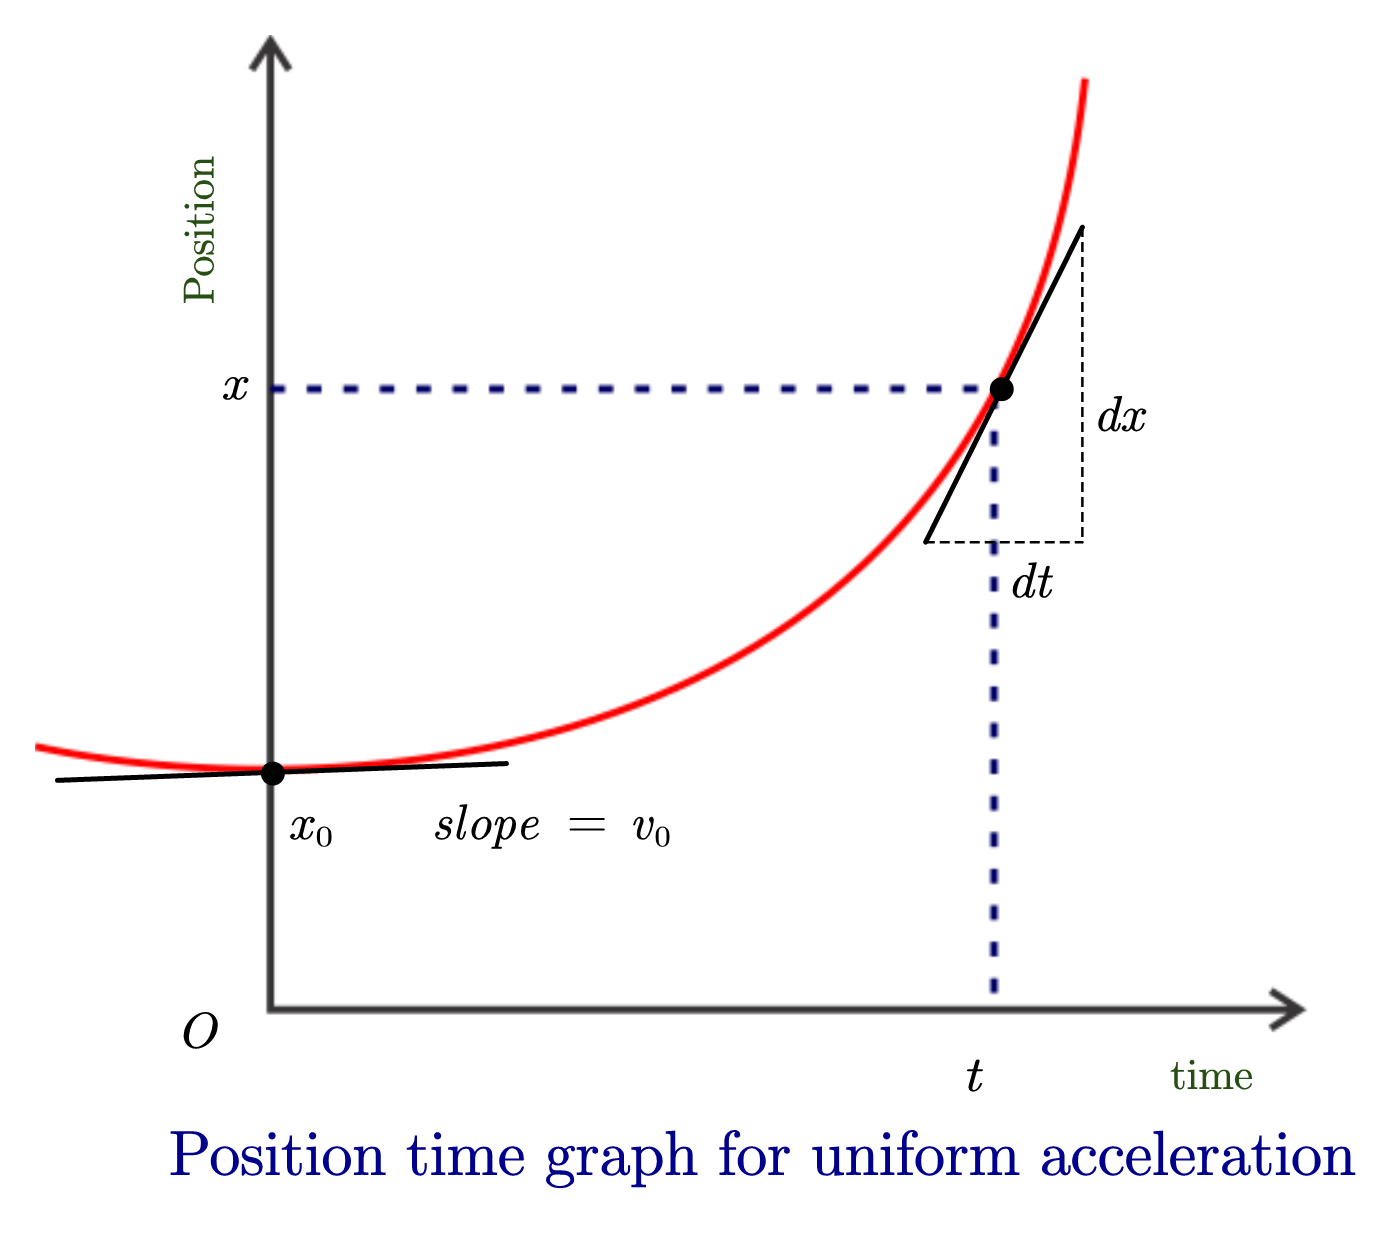
What does the slope of a position-time graph represent for uniform accelerated motion
As established earlier, the \(x\) vs \(t\) graph slope represents the velocity of the object. In the case of uniform accelerated motion slope of the position-time graph gives the instantaneous velocity of the object. Slope of the x-t graph at time \(t=0\) represents the initial velocity \(v_0\) of the object. Let us now calculate the slope of the \(x-t\) for uniform accelerated motion.
The slope of the x-t graph
\(=\frac{\text{Small change in vertical co-ordinate}}{{Small change in horizontal co-ordinate}}\)
\(=\frac{dx}{dt}=\text{velocity at instant t}\)
Important points about the slope of the x-t graph
- The slope of the tangent drawn at any point to the x-t curve gives the instantaneous velocity.
- The steeper the slope at any point, the more the speed at that point.
- The numerical value of the slope of the tangent drawn to the x-t curve gives speed.
- We can find at which particular instant the direction of motion of the particle is changing, these points are where the slope of \(x-t\) plot is zero.
- We can find from the x-t plot, the instant when the particle is moving with the most speed. The instant where the tangent is drawn to \(x-t\) plot is steepest the speed would be maximum.
Position time graph at rest
The figure below shows the x-t graph at rest.
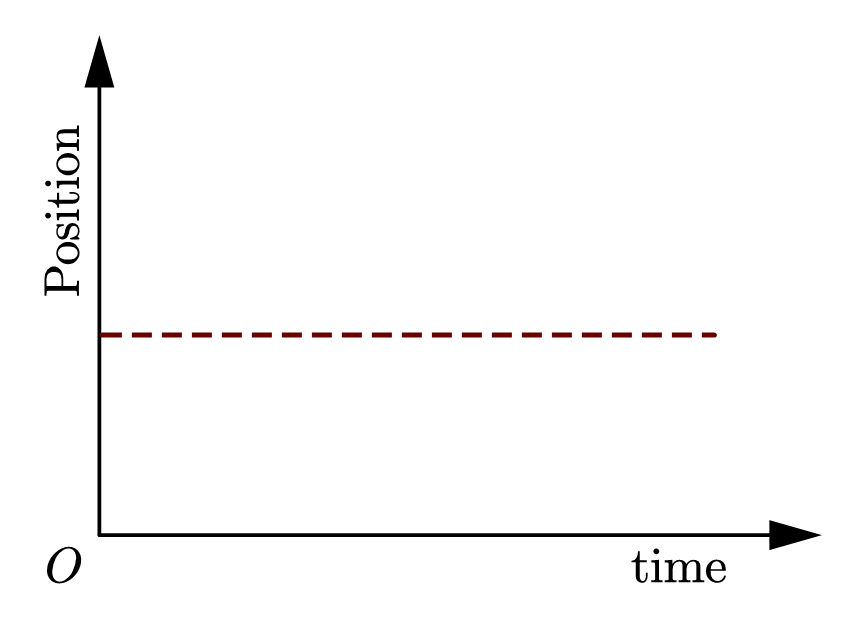
When the object under consideration is at rest then its position does not change with the passage of time.
How to find average velocity on a position-time graph
The slope of the chord joining any two points on the curve gives us the average velocity for a particular time -interval. Now consider the figure given below
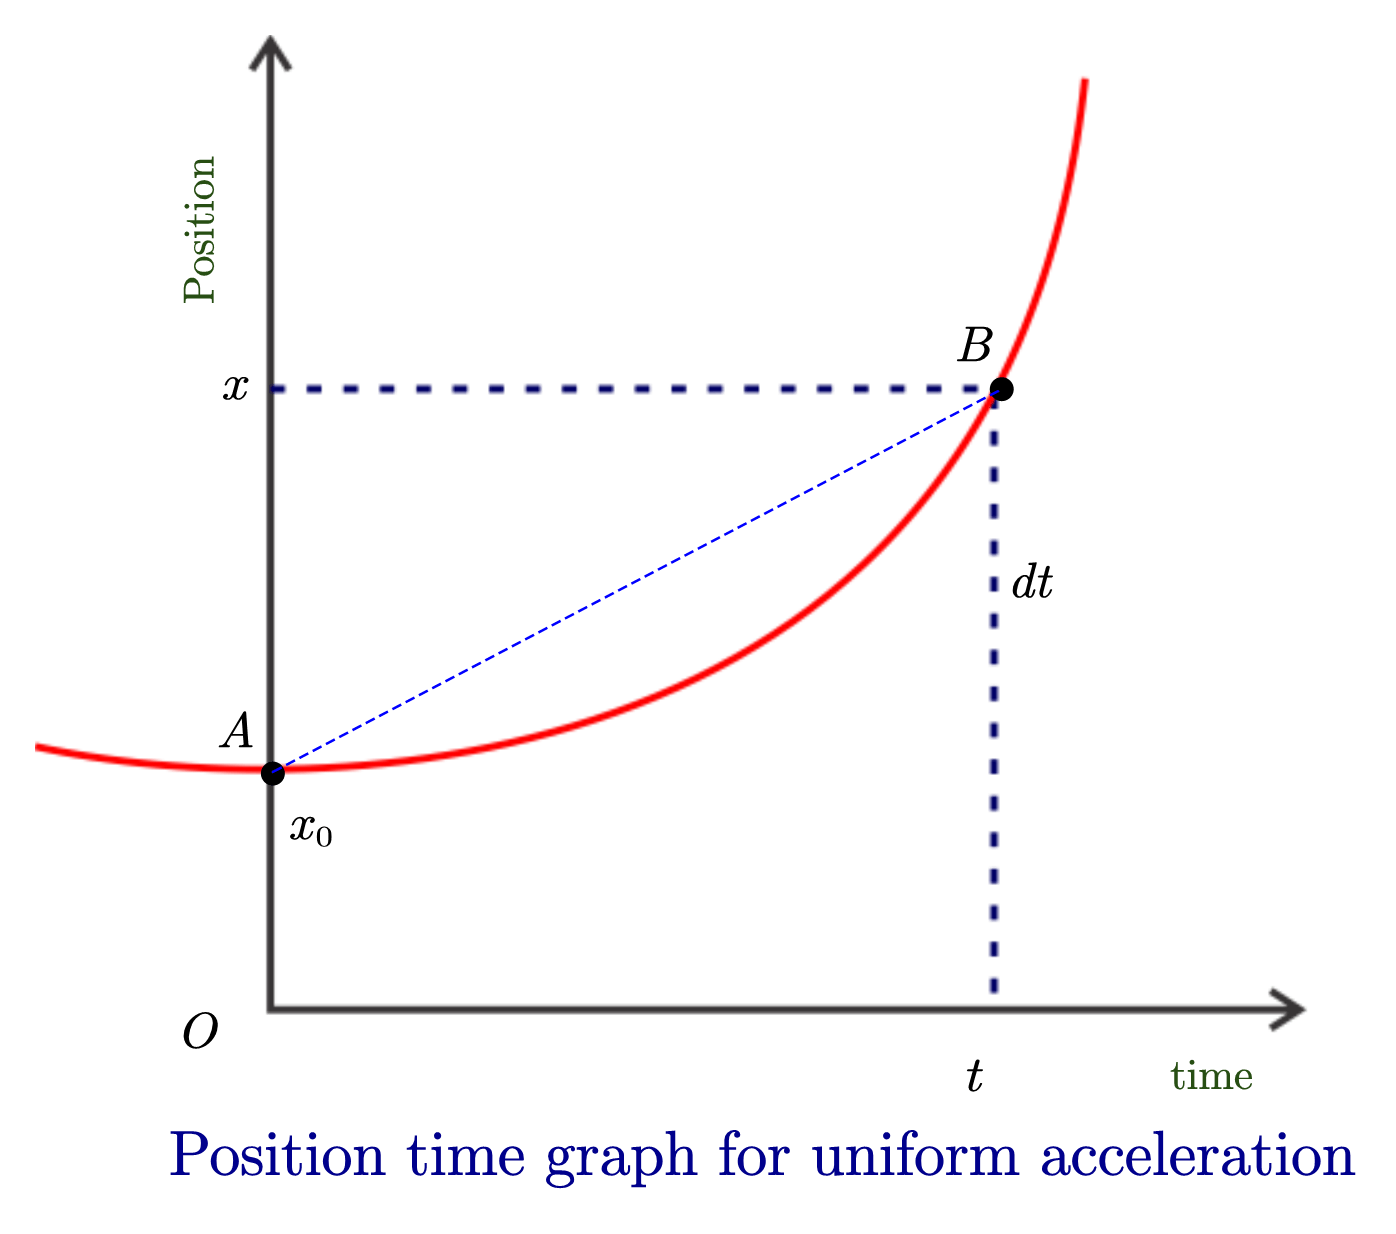
The average velocity of the object between point \(A\) and \(B\) is
the ratio of the displacement \(\Delta x=x_2 – x_1\) of the particle in the time interval \(\Delta t=t_2-t_1\).
Here \(x_1=x_0\) , \(x_2=x\) , \(t_1=0\) and \(t_2=t\) so,
\[v_{avg}=\frac{\Delta x}{\Delta t}=\frac{x-x_0}{t}\]
x-t graph vs Displacement time vs distance-time graph
We can have a displacement of particle and the distance travelled by the particle is any time interval from the plot of the x-t graph.
The position-time graph (x-t) is the same as the displacement-time graph. This graph will tell you the exact change in the position of a body. So it tells about the shortest distance between initial and final position w.r.t time irrespective of the actual path used.
A distance-time graph will tell you the distance covered, that is the exact length of the actual path used to travel from the initial point to the final point, with respect to time.
A distance-time graph does not care about what direction objects are travelling.
Representing accelerated motion
We can find out whether a particle is accelerating or decelerating at a particular instant or rather in a time interval.
If the sign of acceleration and velocity are the same then the particle is accelerating otherwise decelerating.
We can find the sign of acceleration from the \(x-t\) plot but its value can be determined only if we have a detailed description of the x-t plot.
x-t graph for negative acceleration
If \(x-t\) plot is concave down then
\(\frac{d^2x}{dt^2} < 0\)
i.e., acceleration is negative.
x-t graph for positive acceleration
If the $x-t$ plot is concave up then
\(\frac{d^2x}{dt^2}>0 \),
i.e., acceleration is positive.
Frequently Asked Questions
A body having zero acceleration moves with uniform velocity. So, the position-time graph of body having zero acceleration is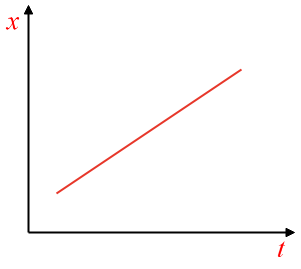
The slope of the displacement time graph gives the velocity of the moving object.
A position-time relationship with a negative slope implies that an object is travelling more quickly in the opposite direction.
It is not possible if a position-time graph has a vertical line because that would indicate that an object is occupying many positions at one time.