Velocity vs Time graph
This article is about the velocity-time graph. Before going further details of the topic let us first understand how to draw these graphs. To draw graphs in x-y- plane
- The independent variable is always taken on the x-axis.
- We plot the dependent variable on the y-axis.
- The dependent variable is dependent on the independent variable through some function. Know more about Functions in Maths
Let us observe the case of Kinematic equations for uniformly accelerated Motion. Time is our fundamental independent variable and position is a dependent variable. Along with position, displacement, velocity, and acceleration are also dependent variables. There are three basic types of motion graphs
- Position-Time Graph (x-t graph)
- Velocity-Time Graph (v-t graph)
- Acceleration-Time Graph
The velocity-time graph is the graph plotted between the velocity of a particle with the passage of time. These graphs are very useful as we can extract various kinds of information from a given v-t graph.
- Velocity and speed of the particle at any instant of time can be found easily from v-t plot.
- From the v-t graph, we can also find the distance traveled by the particle.
- We can also find average speed and average velocity for any time interval from the v-t plot.
- The slope of velocity vs time graph gives the acceleration of the moving body.
Velocity-time graph uniform motion
A body is said to have uniform motion if it covers equal distance in an equal amount of time. In other words, we can say that a body has uniform motion if it moves with a fixed velocity \(\vec v\) in the same fixed direction.
The figure given below shows the v-t graph for a body in uniform motion.
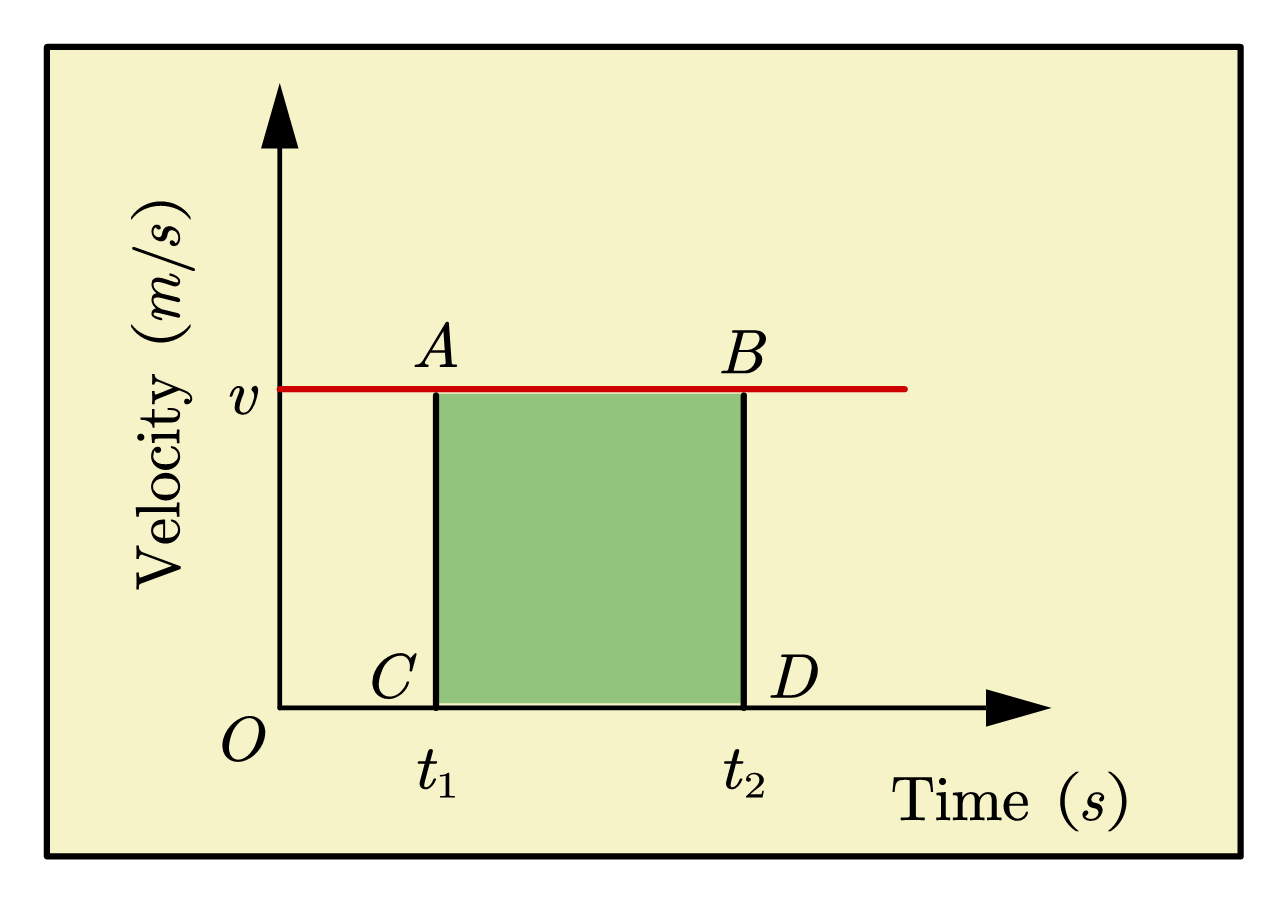
From this graph, we can see that the v-t graph for uniform motion is a straight line parallel to the time axis.
Velocity-time graph uniform acceleration

A body is said to be having uniform acceleration if its velocity changes by an equal amount in equal interval of time. The figure given below shows the v-t plot for a body with uniform acceleration.

Slope of v-t plot
From above plot we can see that \(AB\) is the slope of the plot.
\begin{align*}
\text{Slop AB}=&\tan \theta \\
=&\frac{DE}{CE} = \frac{v_2-v_1}{t_2t_1}\\
=&\frac{\text{change in velocity}}{\text{time interval}} \\
=&\text{ acceleration }(a)
\end{align*}
Hence slope of velocity time graph gives the acceleration of the object.
Finding displacement from these graphs
From the velocity-time graph, we can also find the displacement traveled by the particle in a given time interval. The area under the v-t plot gives the distance covered by the body.
Consider the figure given below

Here in this figure straight line \(PQ\) represents the v-t plot of a body that is moving along a straight-line path and the slope of plot \(PQ\) represents the acceleration \(a\) of the body.
Let \(v_0\) be the initial velocity and \(v\) be the velocity at time \(t\) respectively.
\[
\text{Area under velocity time graph PQ}=\text{Area of trapezium OPQS}\\
=\text{area under triangle PQR }+\,\,\text{area under rec}\tan\text{gle OPRS}\\
=\left( \frac{1}{2}\times PR\times QR \right) +OP\times PR\\
=PR\left( \frac{1}{2}QR+OP \right) =t\times \left( \frac{1}{2}\times \left( v-v_0 \right) +v_0 \right)\\
=\frac{1}{2}\left( v+v_0 \right) \times t
=\text{distance traveled in time }t
\]
So, area under trapezium is average velocity times time interval which is equal to displacement of body in time \(t\)
One point you have to keep in mind is whether the velocity is changing its sign or not.
- If velocity is not changing its sign in a particular time interval, then
displacement = area under v-t curve. - If velocity is changing its sign, then
displacement = area under the v-t curve and distance = sum of the areas of the v-t curve below and above the time axis.
Related articles and study material
- learn more about motion graphs by following this link: graphs in motion
- New Simplified Physics by SL Arora Class 11(Set of… : Book I highly recommend for class 11 students as the language and content is easy to understand.
- Mastering Kinematics : Good course on mastering kinematics.
- University Physics with Modern Physics: By far my favorite book in physics. This book provides a very good explanation of physics concepts.
Note to our visitors:-
Thanks for visiting our website.
DISCLOSURE: THIS PAGE MAY CONTAIN AFFILIATE LINKS, MEANING I GET A COMMISSION IF YOU DECIDE TO MAKE A PURCHASE THROUGH MY LINKS, AT NO COST TO YOU. PLEASE READ MY DISCLOSURE FOR MORE INFO.