NCERT Solutions for Class 10 Maths:Chapter 14 Statistics Exercise 14.2
In this page we have NCERT Solutions for Class 10 Maths:Chapter 14 Statistics for
Exercise 14.2 on pages 275,276. Hope you like them and do not forget to like , social_share
and comment at the end of the page.
Formula
The mode for grouped data can be found by using the formula
$\text{Mode} = l + \left ( \frac {f_1 - f_0}{2f_1 - f_1-f_2} \right ) \times h$
Where
l = lower limit of the modal class
h = size of the class interval (assuming all class sizes to be equal)
$f_1$ = frequency of the modal class
$f_0$ = frequency of the class preceding the modal class
$f_2$ = frequency of the class succeeding the modal class.
Statistics Exercise 14.2
Question 1
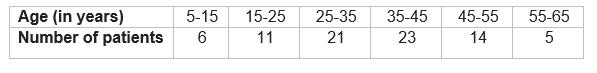
The following table shows the ages of the patients admitted in a hospital during a year
Find the mode and the mean of the data given above. Compare and interpret the two measures of central tendency. Solution
The mode for grouped data can be found by using the formula
$\text{Mode} = l + \left ( \frac {f_1 - f_0}{2f_1 - f_1-f_2} \right ) \times h$
Where
l = lower limit of the modal class
h = size of the class interval (assuming all class sizes to be equal)
$f_1$ = frequency of the modal class
$f_0$ = frequency of the class preceding the modal class
$f_2$ = frequency of the class succeeding the modal class.
Modal class = 35 – 45, l = 35, class width (h) = 10, f1 = 23, f0 = 21 and f2 = 14
Substituting the values, we get
Mode= 36.8 year
Now Calculation of Mean
Class Interval
Frequency (fi)
Mid-point (xi)
fixi
5-15
6
10
60
15-25
11
20
220
25-35
21
30
630
35-45
23
40
920
45-55
14
50
700
55-65
5
60
300
∑ fi = 80
∑ fixi = 2830
$M= \frac { \sum f_i x_i}{\sum f_i}$
= 2830/80 = 35.37 yr
So, Maximum number of patients are of age 36.8 year and Mean age of the patient is 35.37 year Question 2
The following data gives the information on the observed lifetimes (in hours) of 225
electrical components:
Determine the modal lifetimes of the components. Solution
The mode for grouped data can be found by using the formula
$\text{Mode} = l + \left ( \frac {f_1 - f_0}{2f_1 - f_1-f_2} \right ) \times h$
Where
l = lower limit of the modal class
h = size of the class interval (assuming all class sizes to be equal)
$f_1$ = frequency of the modal class
$f_0$ = frequency of the class preceding the modal class
$f_2$ = frequency of the class succeeding the modal class.
Modal class of the given data is 60–80.
Modal class = 60-80, l = 60, f1 = 61, f0 = 52, f2 = 38 and h = 20
Substituting these values, we get
Mode = 65,625
Question 3
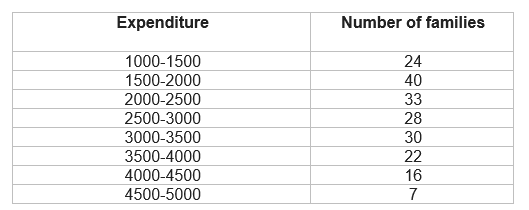
The following data gives the distribution of total monthly household expenditure of 200
families of a village. Find the modal monthly expenditure of the families. Also, find the
mean monthly expenditure:
Solution
The mode for grouped data can be found by using the formula
$\text{Mode} = l + \left ( \frac {f_1 - f_0}{2f_1 - f_1-f_2} \right ) \times h$
Where
l = lower limit of the modal class
h = size of the class interval (assuming all class sizes to be equal)
$f_1$ = frequency of the modal class
$f_0$ = frequency of the class preceding the modal class
$f_2$ = frequency of the class succeeding the modal class.
Modal class = 1500-2000, l = 1500, f1 = 40, f0 = 24, f2 = 33 and h = 500
Substituting these values, we get
Mode= Rs 1847.83
Calculation for mean
Question 4
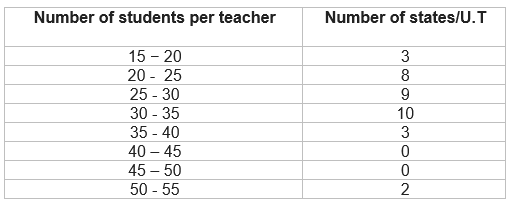
The following distribution gives the state-wise teacher-student ratio in higher secondary
schools of India. Find the mode and mean of this data. Interpret the two measures.
Solution
$\text{Mode} = l + \left ( \frac {f_1 - f_0}{2f_1 - f_1-f_2} \right ) \times h$
Where
l = lower limit of the modal class
h = size of the class interval (assuming all class sizes to be equal)
$f_1$ = frequency of the modal class
$f_0$ = frequency of the class preceding the modal class
$f_2$ = frequency of the class succeeding the modal class.
Modal class = 30-35, l = 30, f1 = 10, f0 = 9, f2 = 3 and h = 500
Substituting these values, we get
Mode= 30.6
Calculation for mean by step deviation method ( Assumed mean 32.5)
Question 5
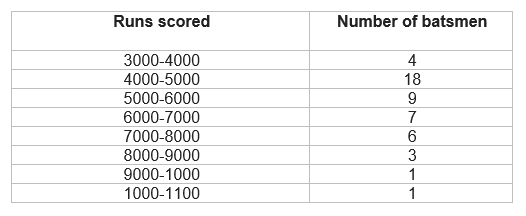
The given distribution shows the number of runs scored by some top batsmen of the
world in one-day international cricket matches.
Find the mode of the data. Solution
$\text{Mode} = l + \left ( \frac {f_1 - f_0}{2f_1 - f_1-f_2} \right ) \times h$
Where
l = lower limit of the modal class
h = size of the class interval (assuming all class sizes to be equal)
$f_1$ = frequency of the modal class
$f_0$ = frequency of the class preceding the modal class
$f_2$ = frequency of the class succeeding the modal class.
From the given data, it can be observed that the maximum class frequency is 18,
belonging to class interval 4000 − 5000. Therefore, modal class = 4000 − 5000
Lower limit (l) of modal class = 4000
Frequency (f1) of modal class = 18
Frequency (f0) of class preceding modal class = 4
Frequency (f2) of class succeeding modal class = 9
Class size (h) = 1000
Substituting these values, we get
Mode =4608.7 runs
Question 6
A student noted the number of cars passing through a spot on a road for 100 periods each of 3 minutes and summarized it in the table given below. Find the mode of the data
Number of cars
0-10
10-20
20-30
30-40
40-50
50-60
60-70
70-80
Frequency
7
14
13
12
20
11
15
8
Solution
$\text{Mode} = l + \left ( \frac {f_1 - f_0}{2f_1 - f_1-f_2} \right ) \times h$
Where
l = lower limit of the modal class
h = size of the class interval (assuming all class sizes to be equal)
$f_1$ = frequency of the modal class
$f_0$ = frequency of the class preceding the modal class
$f_2$ = frequency of the class succeeding the modal class.
Here maximum class frequency is 20, belonging to 40 − 50 class intervals. Therefore, modal class = 40 − 50
Lower limit (l) of modal class = 40
Frequency (f1) of modal class = 20
Frequency (f0) of class preceding modal class = 12
Frequency (f2) of class succeeding modal class = 11
Substituting these values, we get
ode =44.7
Summary
NCERT Solutions for Class 10 Maths:Chapter 14 Statistics Exercise 14.1 has been prepared by Expert with utmost care. If you find any mistake.Please do provide feedback on mail.You can download this as pdf Download Class 10 Statistics Exercise 14.2 as pdf
This chapter 13 has total 5 Exercise 14.1 and 14.2. This is the First exercise in the chapter.You can explore previous exercise of this chapter by clicking the link below