In this page we will explain the topics for the chapter 14 of Statistics Class 10 Maths.We have given quality Introduction to Statistics Class 10 Notes to explain various things so that students can benefits from it and learn maths in a fun and easy manner, Hope you like them and do not forget to like , social share
and comment at the end of the page.
A systematic record of facts or different values of a quantity is called data.
Features of the data
Statistics deals with collection, presentation, analysis and interpretation of numerical data.
Arranging data in a order to study their salient features is called presentation of data.
Data arranged in ascending or descending order is called arrayed data or an array
Range of the data is the difference between the maximum and the minimum values of the observations
Table that shows the frequency of different values in the given data is called a frequency distribution table
A frequency distribution table that shows the frequency of each individual value in the given data is called an ungrouped frequency distribution table.
A table that shows the frequency of groups of values in the given data is called a grouped frequency distribution table
The groupings used to group the values in given data are called classes or class-intervals. The number of values that each class contains is called the class size or class width. The lower value in a class is called the lower class limit. The higher value in a class is called the upper class limit.
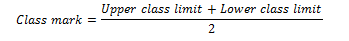
Class mark of a class is the mid value of the two limits of that class.
A frequency distribution in which the upper limit of one class differs from the lower limit of the succeeding class is called an Inclusive or discontinuous Frequency Distribution.
A frequency distribution in which the upper limit of one class coincides from the lower limit of the succeeding class is called an exclusive or continuous Frequency Distribution
Bar Graph:
A bar graph is a pictorial representation of data in which rectangular bars of uniform width are drawn with equal spacing between them on one axis, usually the x axis. The value of the variable is shown on the other axis that is the y axis.
Histogram:
A histogram is a set of adjacent rectangles whose areas are proportional to the frequencies of a given continuous frequency distribution
Mean
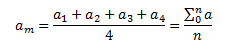
The mean value of a variable is defined as the sum of all the values of the variable divided by the number of values.
Median
The median of a set of data values is the middle value of the data set when it has been arranged in ascending order. That is, from the smallest value to the highest value
Median is calculated as
Where n is the number of values in the data. If the number of values in the data set is even, then the median is the average of the two middle value
Mode
Mode of a statistical data is the value of that variable which has the maximum frequency
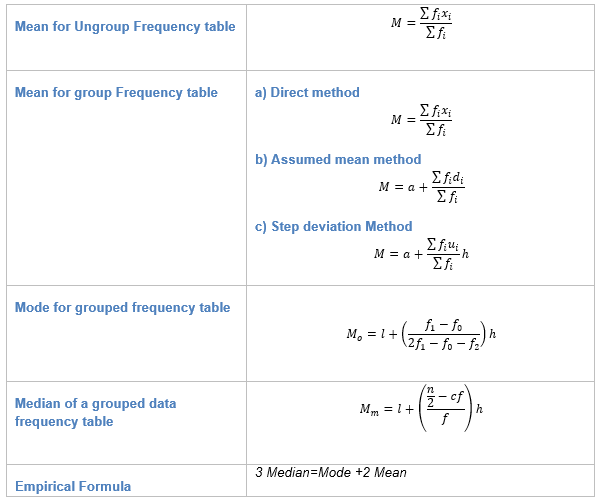
Mean for Ungroup Frequency table
Here is the ungroup Frequency table
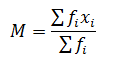
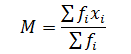
Mean is given by
Greek letter ∑ (capital sigma) means summation Example
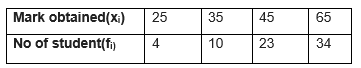
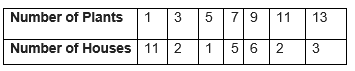
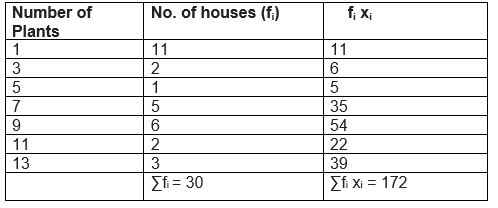
A survey was conducted by a group of students as a part of their environment awareness programmes, in which they collected the following data regarding the number of plants in 30 houses in a locality. Find the mean number of plants per house.
Solution
Mean = 172/30 = 5.73
Mean for group Frequency table
In these distribution, it is assumed that frequency of each class interval is centered around its mid-point i.e class marks
Mean can be calculated using three method
(a) Direct method
This method can be very calculation intensive if the values of f and x are large.We have big calculations and chance of making mistake is quite high
Steps involved in finding the mean using Direct Method
(1) Prepare a frequency table with the help of class marks
(2) Multiply fi x i and find the sum of it.
(4) Use the above formula and find the mean. Example
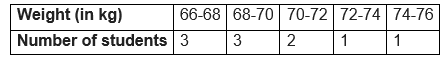
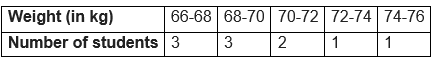
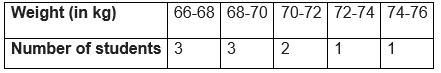
The following table shows the weights of 10 children:
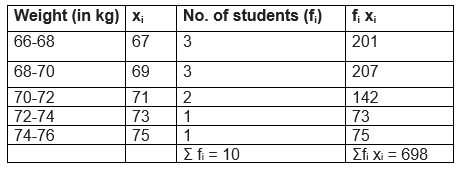
Find the mean by using direct method. Solution:
So, Mean would be
=698/10 = 69.8 kg
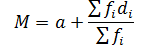
(b) Assumed mean method
Where
a=> Assumed mean
di => xi –a
This method is quite useful when the values of f and x are large. It makes the calculation easiar.In this method we take some assumed mean and calculate the deviation from it and then calculate mean using above formula Steps involved in finding the mean using Assumed Mean Method
(1) Prepare a frequency table.
(2) Choose A and take deviations di = xi - A of the values of xi .
(3) Multiply fi d i and find the sum of it.
(4) Use the above formula and find the mean. ExampleExample
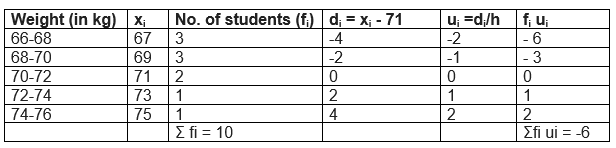
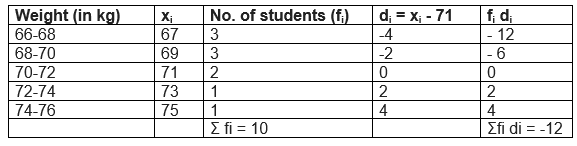
The following table shows the weights of 10 children:
Find the mean by using Assumed Mean method. Solution:
Let the assumed mean = A = 71
So, Mean would be
=71-12/10 = 69.8 kg
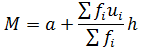
c) Step deviation Method
Where
a=> Assumed mean
ui => (xi –a)/h
This method is quite useful when the values of f and x are large. It makes the calculation further easiar by dividing the deviation from common factor. Steps involved in finding the mean using Step Deviation Method
(1) Prepare a frequency table.
(2) Choose A and h and take ui = (xi –a)/h of the values of xi .
(3) Multiply fi u i and find the sum of it.
(4) Use the above formula and find the mean. Example
The following table shows the weights of 10 children:
br>
Find the mean by using Step Deviation method. Solution:
Let the assumed mean = A = 71 and h=2
So, Mean would be
=71+ (-6/10) 2 = 69.8 kg
Important points
(1)The mean obtained by all these three methods are same.
(2) The assumed mean method and step-deviation method are just simplified forms of the direct method.
Mode for grouped frequency table
Modal class: The class interval having highest frequency is called the modal class and Mode is obtained using the modal class
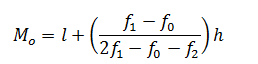
Mode formula is given as
Where
l = lower limit of the modal class,
h = size of the class interval (assuming all class sizes to be equal),
f1 = frequency of the modal class,
f0 = frequency of the class preceding the modal class,
f2 = frequency of the class succeeding the modal class. Example
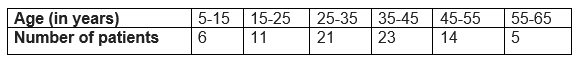
The following table shows the ages of the patients admitted in a hospital during a year
Find the mode Solution
Modal class = 35 – 45, l = 35, class width (h) = 10, f1 = 23, f0 = 21 and f2 = 14
Substituting the values in the Mode formula given above we get
Mode= 36.8 year
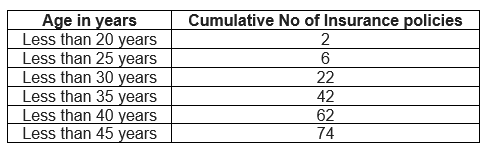
Cumulative Frequency chart
The cumulative frequency of a class is the frequency obtained by adding the frequencies of all the classes preceding the given class.
Cumulative Frequency chart will be like
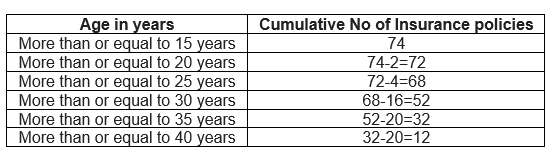
The above table cumulative frequency distribution of the less than type. We can similary make it like below
The table above is called a cumulative frequency distribution of the more than type.
Median of a grouped data frequency table
How to find Median of a grouped data frequency table
(1) For the given data, we need to have class interval, frequency distribution and cumulative frequency distribution
(2)Then we need to find the median class How to find the median class
(a) we find the cumulative frequencies of all the classes and n/2
(b)We now locate the class whose cumulative frequency is greater than (and nearest to) n/2
(c)That class is called the median class
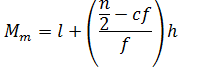
(3) Median is calculated as per the below formula
Where
l = lower limit of median class,
n = number of observations,
cf = cumulative frequency of class preceding the median class,
f = frequency of median class,
h = class size (assuming class size to be equal) Example
A survey regarding the heights (in cm) of 60 girls of a school was conducted and the following data was obtained:
Height (in cm)
Number of girls
Less than 140
4
Less than 145
11
Less than 150
29
Less than 155
40
Less than 160
46
Less than 165
60
Find the median height Solution
To calculate the median height, we need to find the class intervals and their corresponding frequencies.
The given distribution being of the less than type, 140, 145, 150, . . ., 165 given the upper limits of the corresponding class intervals.
So, the classes should be below 140, 140 - 145, 145 - 150, . . ., 160 - 165. Observe that from the given distribution, we find that there are 4 girls with height less than 140, i.e., the frequency of class interval below 140 is 4 . Now, there are 11 girls with heights less than 145 and 4 girls with height less than 140. Therefore, the number of girls with height in the interval 140-145 will be 11-4=7. Similarly, other can be calculated
Class interval
Frequency
Cumulative Frequency
Below 140
4
4
140-145
7
11
145-150
18
29
150-155
11
40
155- 160
6
46
160- 165
14
60
So, n =60 and n/2=30 And cumulative frequency which is greater than and nearest to 30 is 40 , So median class 150-155 l (the lower limit) = 150,
cf (the cumulative frequency of the class preceding 150 - 155) = 29, f (the frequency of the median class 150 - 151) = 11, h (the class size) = 5.
Now by Median Formula
= 150 + [(30-29)/11]5
=150.45 cm
Empirical Formula between Mode, Mean and Median
Empirical Formula between Mode, Mean and Median is given as
3 Median=Mode +2 Mean
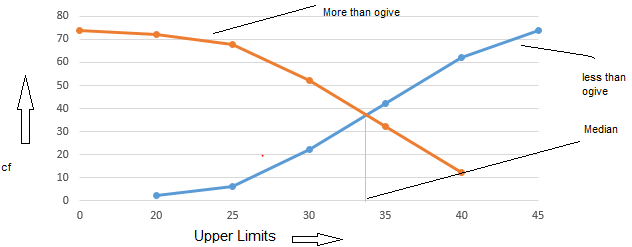
Graphical representation of Cummulative frequency distribution
We can represent Cummulative frequency distribution on the graph also. To represent the data in the table graphically, we mark the upper limits of the class intervals on the horizontal axis (x-axis) and their corresponding cumulative frequencies on the vertical axis (y-axis), choosing a convenient scale.
When we draw the graph for the cumulative frequency distribution of the less than type.The curve we get is called a cumulative frequency curve, or an ogive (of the less than type).
When we draw the graph for the cumulative frequency distribution of the more than type.The curve we get is called a cumulative frequency curve, or an ogive (of the more than type).
When we plot both these curve on the same axis, The two ogives willintersect each other at a point. From this point, if we draw a perpendicular on the x-axis, the point at which it cuts the x-axis gives us the median
Summary of Statistics Class 10 Formulas
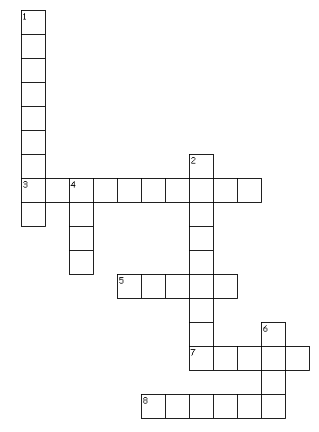
Crossword Puzzle Across
3. The ........ frequency of a class is the frequency obtained by adding the frequencies of all the classes preceding the given class.
5. It is the difference between the maximum and minimum values in data set.
7. The highest frequency class interval is .....class
8. Middle value of the dataset Down
1. Terms for number of times the event occurred in an experiment or study
2. It is a set of adjacent rectangles whose areas are proportional to the frequencies of a given continuous frequency distribution
4. Maximum frequency data in data set
6. Average value of a data set


 br>
br>