In this page we have Data Handling Class 8 Worksheet. This worksheet contains Multiple choice questions and subjective questions on both Data handling and Probability for Class 8 maths. Hope you like them and do not forget to like , social share
and comment at the end of the page.
Multiple choice Questions
Question 1
The probability of getting a vowel in the work "EDUCATION" is
(a) 1/2
(b) 5/9
(c) 1/3
(d) 2/3 Question 2
A dice is thrown two times and sum of the numbers appearing on the dice are noted. The number of possible outcomes is
(a) 36
(b) 18
(c) 11
(d) 6 Question 3
What is the range of the given data
2, 3,5,7,8,9,34,23,11,23,33,1,39
(a)14
(b)38
(c)39
(d)30 Question 4
What is class Mark of the interval 40-50
(a)10
(b)45
(c)40
(d)50 Question 5
A coin is tossed three times. The number of possible outcomes is
(a)2
(b)4
(c)8
(d)16 Question 6
which of the following is True
(a)In a throw of a dice, the probability of getting an even number is the same as that of getting an odd number
(b)In a throw of a dice, the probability of getting an prime number is 1/3
(c)In a throw of a dice, the probability of getting an 7 is 1
(d)In a throw of a dice, the probability of occurence of a composite number is 2/3 Question 7
which of the following is false
(a)The total angle at the centre of the circle in a pie chart is 360°
(b)The pie chart is a pictorial chart
(c)If the value of the component with central 20° in a pie chart is 80, the value of the component with 15° will be 60
(d)None of the above Question 8
In a frequency distribution with classes 0 –10, 10 –20 etc., the size of the class intervals is 10. The lowest limit of 7th class is
(a) 70
(b) 60
(c) 65
(d) 50
Answer
1. (b)
As Total letters in the word =9, Total number of Vowels=5
Probability=5/9
2. (c)
[Possible sums are 2, 3, 4, 5, 6, 7, 8, 9, 10, 11, 12]
3. (b)
Range=highest observation - lowest observation=38
4.(b)
Class Mark= (40+50)/2=45
5. (c)
6. (a)
7. (b)
8. (b)
Subjective Questions
Question 9
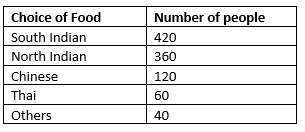
The choice of the food in a groupf of 1000 people is as
Draw a pei chart for the given data
Question 10
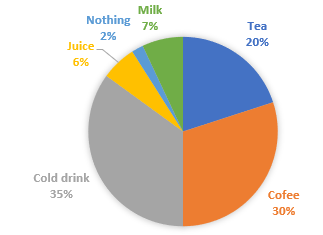
A survey was carried out to find the favourite beverage preferred by a certain group of young people. The following pie chart shows the findings of this survey.
From this pie chart answer the following:
(i) Which type of beverage is liked by the maximum number of people.
(ii) If 60 people like tea, how many people were surveyed?
(iii) How many people does not like any thing in the above people surveyed
Answer
(i) Cold drink
(ii) 20% is 60
So 1% is 60/20=3 people
Therefore 100% is 300 people
(iii) 1% is 3 people
Now Nothing is 2%
Therfore number of people who does not like anything is 6
Question 11
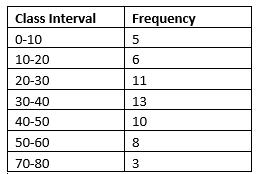
The frequency distribution is given as
Draw the histogram from this chart
Question 12
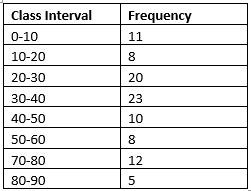
The frequency distribution is given as
(i) Class interval which has the lowest frequency.
(ii) Class interval which has the highest frequency.
(iii) What is the class size of the intervals?
(iv) What is the upper limit of the fifth class?
(v) What is the lower limit of the last class?
Answer
(i) 80-90
(ii) 30 – 40
(iii) 10
(iv) 50
(v) 80
Question 13
A card is drawn from a pack of 52 cards, find the probabilities for below
(a) Diamond
(b) Club or spade
(c) Heart or Spade
(d) Getting a king
(e) Getting a red card
(f) Getting a black card
Answer
In a pack of 52 cards
13 Cards of Diamond. This is red color
13 Cards of Heart. This is red color
13 Cards of Spade. This is black color
13 Cards of club. This is black color
(a) 13/52=1/4
(b) 26/52=1/2
(c) 26/52=1/2
(d) 4/52=1/13
(e) 26/52=1/2
(f) 26/52=1/2
Question 14
A dice is rolled once. What is the probability that the number on top will be
(a) even
(b) Greater than 6
(c) A multiple of 2
(d) A factor of 36
(e) A factor of 6
(f) A prime number
Answer
(a) 3/6=1/2
(b) 0/6=0
(c) 3/6=1/2
(d) 35 factors are 1,2,3,4,6,12,18,36 So answer is 5/6
(e) 35 factors are 1,2,3,6. So anser sis 4/6=2/3
(f) 4/6=2/3
Summary
This Data Handling Class 8 Worksheet is prepared keeping in mind the latest syllabus of CBSE . This has been designed in a way to improve the academic performance of the students. If you find mistakes , please do provide the feebback on the mail.