In this page we will explain the topics for the chapter 4 of Data Handling Class 8 Maths.We have given quality Data Handling Class 8 notes along with video to explain various things so that students can benefits from it and learn maths in a fun and easy manner, Hope you like them and do not forget to like , social share
and comment at the end of the page.
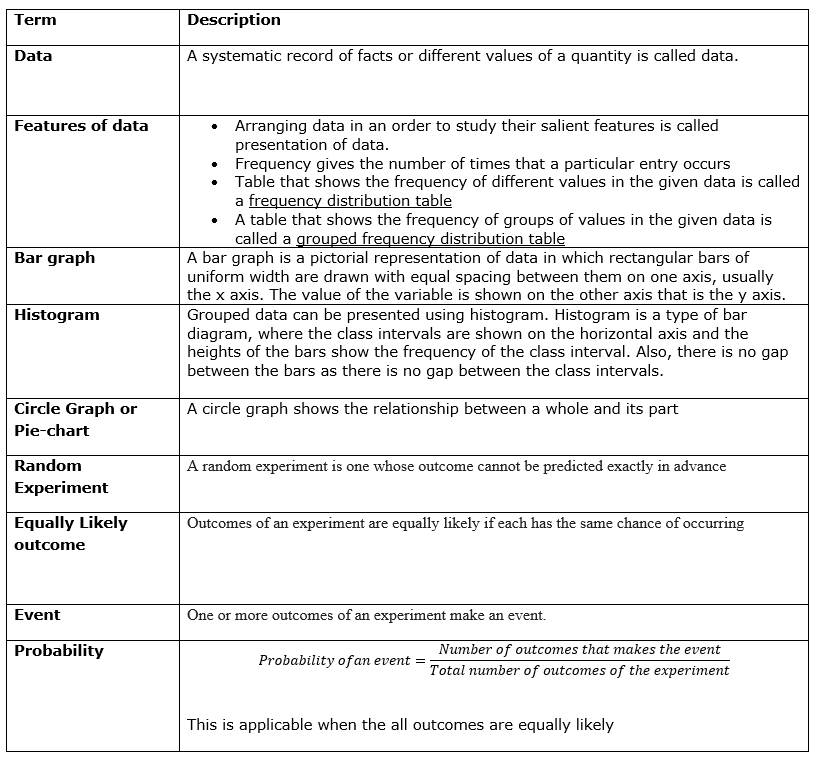
A systematic record of facts or different values of a quantity is called data.
Data mostly available to us in an unorganized form is called raw data.
Arranging data in an order to study their salient features is called presentation of data.
Frequency distribution table
Data is given to us in unorganized form. We organized them to make easy to read
Let’s understand it with an example 20 people were asked for their Favorite IPL team, the answer is
It will be difficult to read this data, so we can organize this data into table format
Team
Number of People
Pune
7
Mumbai
5
Kolkata
3
Delhi
2
Hyderabad
2
Bangalore
1
The number of people is called the frequency Frequency gives the number of times that a particular entry occurs
Table that shows the frequency of different values in the given data is called a frequency distribution table
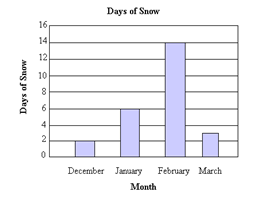
Bar Graph
A bar graph is a pictorial representation of data in which rectangular bars of uniform width are drawn with equal spacing between them on one axis, usually the x axis. The value of the variable is shown on the other axis that is the y axis.
We can represent Frequency distribution table on Bar graph also
Grouped frequency distribution
Sometime data is very huge and it is not easy to create frequency distribution table. Also there will be lot of categories so difficult to distinguish
Let’s Understand this with an example
A class of 50 students was given Physics test of Maximum Mark 60. Here is the test score of the students
20,21,22,22,23,25,26,27,27,26,27,26,29,26,27,25,25,30,51,
55,46,47,48,41,42,31,34,35,35,36,36,37,37,35,37,39,39,37,
36,35,36,36,37,38,38,39,39,43,44,44
If we draw the frequency distribution based on individual marks, it will difficult to understand the data, So for convenience we can group the Marks in equal interval and draw the frequency distribution like below
Class Marks
Frequency
20-25
5
25-30
12
30-35
3
35-40
20
40-45
5
45-50
3
50-55
2
The above table is called grouped frequency distribution
20-25,25-30 are called the class interval
In 20-25 class interval,20 is called lower class limit and 25 is called the upper class limit
The common observation like 20,30, etc. belongs to the higher class interval. So25 will belong to 25-30
Important Definition from above learning
A table that shows the frequency of groups of values in the given data is called a grouped frequency distribution table
The groupings used to group the values in given data are called classes or class-intervals. The number of values that each class contains is called the class size or class width. The lower value in a class is called the lower class limit. The higher value in a class is called the upper class limit.
The common observation will belong to the higher class.
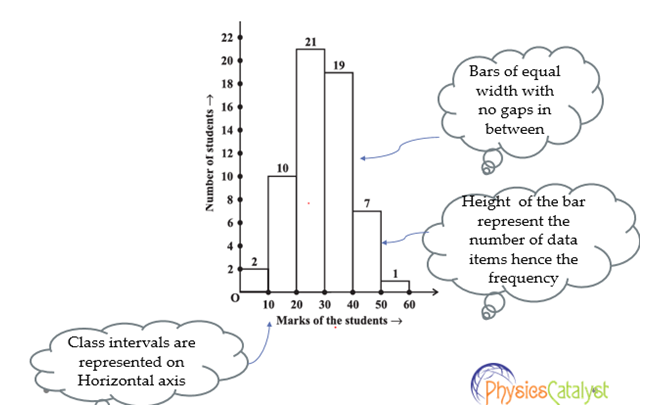
Histogram
Grouped data can be presented using histogram. Histogram is a type of bar diagram, where the class intervals are shown on the horizontal axis and the heights of the bars show the frequency of the class interval. Also, there is no gap between the bars as there is no gap between the class intervals.
Watch this tutorial for more explanation About grouped frequency distribution
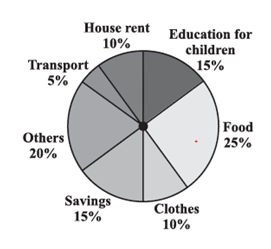
Circle Graph or Pie-chart
A circle graph shows the relationship between a whole and its part. The whole circle is divided into sectors. The size of each sector is proportional to the activity or information it represents
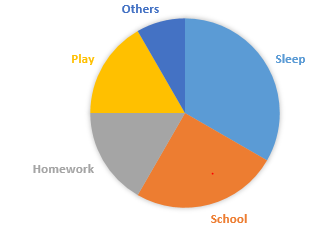
Example
The time spent by a student during a day.
Sleep — 8 hours
School — 6 hours
Homework — 4 hours
Play — 4 hours
Others — 2 hours
Draw the pie chart Solution
Total hours are 24 hours. Now we need to find fraction of each of the activity with respect to whole day and also the angle subtended by that activity to draw the pie chart
Activity
Hours
Fraction
Central Angle
Sleep
8
8/24=1/3
(1/3) ×360=120
School
6
6/24=1/4
(1/4) ×360=90
Homework
4
4/24=1/6
(1/6) ×360=60
Play
4
4/24=1/6
(1/6) ×360=60
Others
2
2/24=1/12
(1/12) ×360=30
Now to draw the Pie chart, follow the below instructions
1) Draw a circle with any convenient radius. Mark its centre (O) and a radius (OA).
2. Start with one activity, the angle of the sector for sleep is 120°.
Use the protractor to draw ∠ 120°.
3. Continue marking the remaining sectors.
Chance or Probability
Random Experiment
A random experiment is one whose outcome cannot be predicted exactly in advance
Example
Throwing a dice
Tossing the coin
Equally Likely outcome
Outcomes of an experiment are equally likely if each has the same chance of occurring
Example
In tossing the coin, both head and tail can come equally likely
In throwing the dice, all the number 1, 2,3,4,5,6 can come equally likely
Event
One or more outcomes of an experiment make an event.
Example
Getting a tail in tossing a coin is an event
Getting a number 1 or getting number 2 .. in a throw of dice are also event
Getting an odd number in a throw of dice is also an event. The event will contain 1,3,5 as outcome
Probability
Probability is calculated as
This is applicable when the all outcomes are equally likely
Example
When a die is thrown, Find the probability of the following
(a) getting prime number
(b) getting not a prime number.
(c) getting a number greater than 4
(d) getting a number not greater than 4. Solution
Total outcome from the dice are 1,2,3,4,5, 6. So 6
a) getting prime number
1,2,3,5 are the prime number
So probability = 4/6= 2/3
b) getting not a prime number
4,6 are not prime number
So Probability = 2/6= 1/3
c) getting a number greater than 4
5,6 satisfies the requirement
So probability = 2/6= 1/3
d) getting a number less than 4
1,2 ,3 satisfies the requirement
So probability = 3/6= 1/2
Watch this tutorial for question About grouped frequency distribution