Graphical Solution of Linear inequalities in Two Variable
Graphing Linear inequalities in Two Variable.
A linear equation in two variable is of the form
$ax+by+c=0$
We have already studied in Coordinate geometry that this can be represented by a straight line in x-y plane. All the points on the straight line are the solutions of this linear equation.
we can similarly find the solution set graphically for the linear inequalities in the below form
$ax+by+c< 0$
$ax+by+c> 0$
$ax+by+c \geq 0$
$ax+by+c \leq 0 $
How to find the solution graphicaly for Linear inequalities in Two Variable.
Draw the graph of the equation obtained for the given inequality by replacing the inequality sign with an equal sign.
$ax+by+c=0 $
This can be done easily by Point on the x-axis( x,0) and point on the y axis ( 0,y)
Point on x-axis given by $ax+b(0)+c=0 $ or $x=\frac {-c}{a}$ or $(\frac {-c}{a} ,0)$
Point on y-axis given by $a(0)+by+c=0 $ or $y=\frac {-c}{b}$ or $(0,\frac {-c}{b})$
Locate these point on cartesian plane and join them to find the line
Use a dashed or dotted line if the problem involves a strict inequality, < or >.
Otherwise, use a solid line to indicate that the line itself constitutes part of the solution.
Pick a point lying in one of the half-planes determined by the line sketched in step 1 and substitute the values of x and y into the given inequality.
Use the origin whenever possible.
If the inequality is satisfied, the graph of the inequality includes the half-plane containing the test point.
Otherwise, the solution includes the half-plane not containing the test point
Example
Determine the solution set for the inequality
$x+y > 1$ Solution
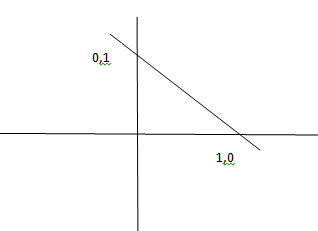
1) Draw the graph of the equation obtained for the given inequality by replacing the inequality sign with an equal sign.
i.e $x+y=1 $
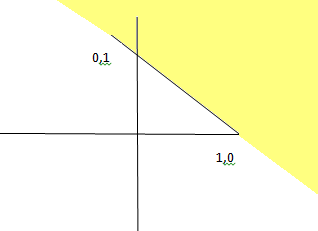
2) Pick the test point as origin (0,0), and put into the inequality
$0+0 > 1$
$0> 1$
Which is false
So the solution set is other half plane of the line
How to find the solution graphicaly for pair of Linear inequalities in Two Variable.
$ax+by+c< 0$
$px+qy+c < 0$
The solution set of a system of linear inequalities in two variables x and y is the set of all points (x, y) that satisfy each inequality of the system. Step
Find the graphical solution for each inequality independently using the technique decsribed above
Now determine the region in common with each solution set
Example
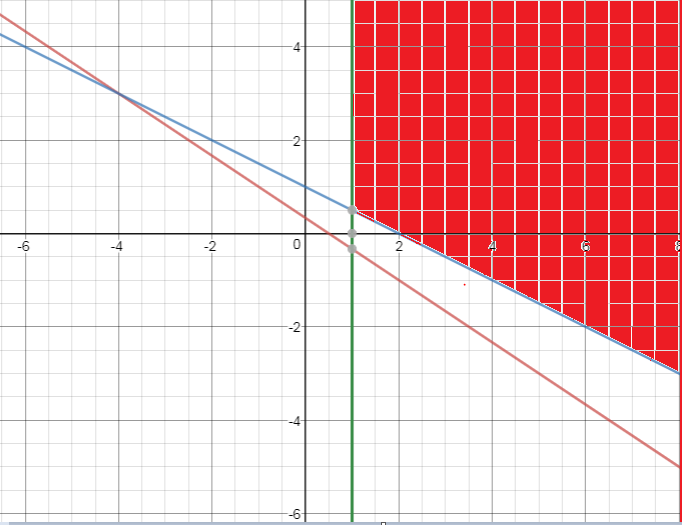
Find the solution of the below system of inequalities
$2x+3y >1$
$x+2y >2$
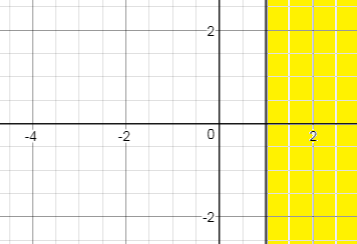
$x>1$ Solution
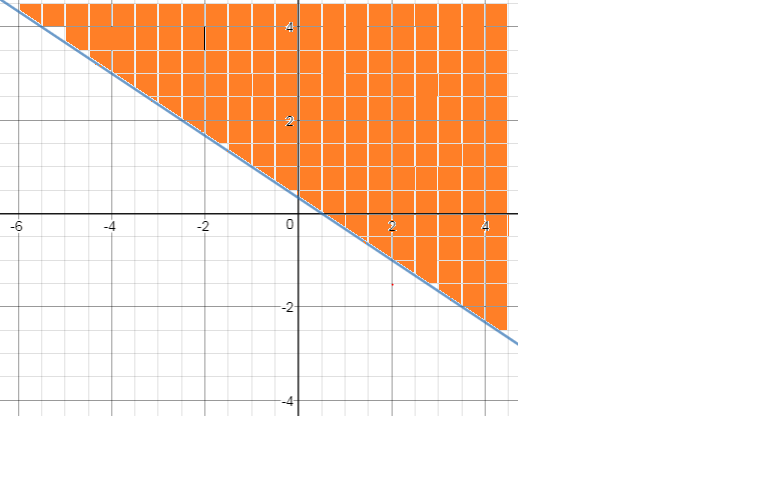
1) for $2x+3y >1$, Solving using the above method solution is
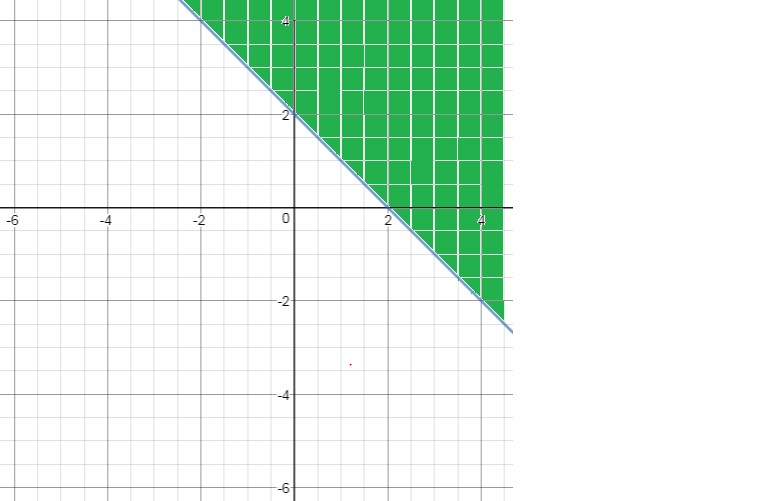
2)for $x+2y >2$, Solving using the above method solution is
3) for $x>1$, Solving using the above method solution is
4) Now we draw these on the single graph and can determine the common region