In this page we have Class 6 Maths Data Handling Worksheet. Hope you like them and do not forget to like , social share
and comment at the end of the page.
Question 1
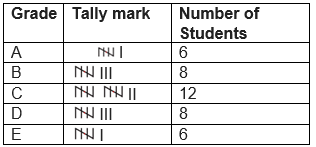
In an examination, the grades achieved by 40 students of a class are given below
B, C, C, E, A, C, B, B, D, D, D, D, B, C, C, C, A, C, B, E, A, D, C, B, E, C, B, E, C, D, A, B, C, E, D, D, A, A, C, E
(a) Arrange the grades using tally marks
(a) How many students get grade A?
(c) How many students get grade E?
(d) The grade where maximum students are present
(e) The grades where minimum students are present Answer
(a)
(b) 6
(c) 6
(d) C
(e) A and E
Question 2
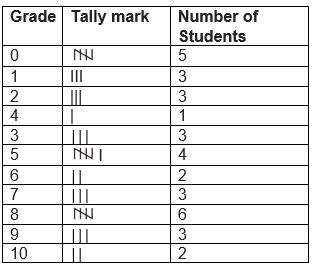
The marks (out of 10) obtained by 35 students in a Science test are listed as below:
8, 1, 2, 6, 5, 5, 5, 0, 1, 9, 7, 8, 0, 5, 8, 3, 0, 8, 10, 10, 3, 4, 8, 7, 8, 9, 2, 0 ,9,6,7,0,1,3,2
(a) Find the number of students who obtained marks more than or equal to 5
(b) Find the numbers of students who scored zero in the test?
(c) If the passing criterion is equal or above six, what is the passing percentage? Answer
(a) More than and equal to five = 4+2 +3+6+3+2=20
(b) 5
(c)More than and equal to six=2 +3+6+3+2=16
Passing %= 16/35 * 100 =45.7%
Question 3
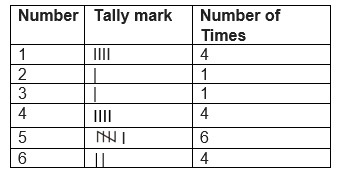
Rakesh threw a dice 20 times and noted the number appearing each time as shown below:
4 3 5 5 6 2 5 4 6 1
6 5 4 4 6 1 5 5 1 1
Make a table and enter the data using tally marks.
Find the number that appeared.
(a) The minimum number of times
(b) The maximum number of times
(c) Find those numbers that appear an equal number of times
(d) Find the count when even number turned up
(f) Find the count when odd number turned up Answer
(a)2 and 3
(b) 5
(c) 2 and 3 , 1,4 and 6
(d) 9
(e) 11
Question 4
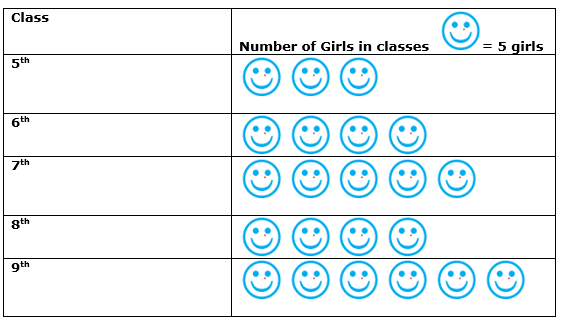
Following pictograph shows the number of girls in five classes.
Answer the below questions:
(a) Which class has the minimum number of girls?
(b) Which class has the maximum number of girls?
(c) How many girls are there in Class 6?
(d) What is the total number of girls in the Classes 6 to 9? Answer
(a)5th
(b)9th
(c)20 girls
(d)110 girls
Question 5
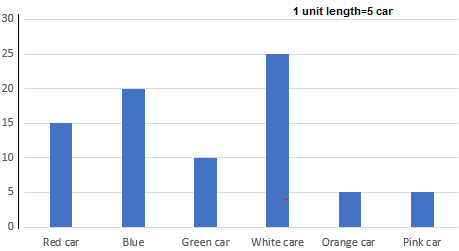
The following bar graph shows the number of car in a society based on the color type. Read the bar graph and answer the following questions:
(a)Which color car is preferred by the owners?
(b) which two colors have same number of cars?
(c) how many different type of car color is available in the society?
d) The number of car having blue color is 5 more than number of car having red car. Is this a true statement?
e) The total number of car available in the society is _________ Answer
(a)white
(b)Orange and pink
(c)6
(d)False
(e)400 car
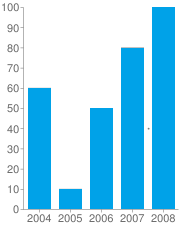
Question 6
The above bar graph shows the production of rice in tons in the year from 2004 to 2008
(a) How many tons of rice was produced from 2004 to 2008?
(b) which year least production happened
(c) which year maximum production happened Answer