NCERT solution for Class 6 Maths Chapter 9:Data Handling
In this page we have NCERT solution for Class 6 Maths Chapter 9:Data Handling . Hope you like them and do not forget to like , social share
and comment at the end of the page.
Drawing a pictograph,A bar graph are deleted from the CBSE Syllabus as per rationalized content.So you may skip the exercises 9.2,9.3.9.4
Question 1
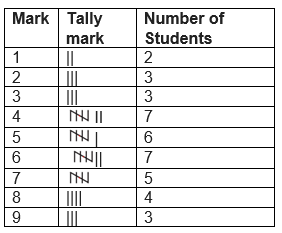
In a Mathematics test, the following marks were obtained by 40 students. Arrange these marks in a table using tally marks.
8 1 3 7 6 5 5 4 4 2
4 9 5 3 7 1 6 5 2 7
7 3 8 4 2 8 9 5 8 6
7 4 5 6 9 6 4 4 6 6
(a) Find how many students obtained marks equal to or more than 7.
(b) How many students obtained marks below 4? Answer
we can construct the table as follows.
(a) The students who obtained their marks equal to or more than 7 are the students who obtained their marks as either of 7, 8, and 9. Hence, number of these students = 5 + 4 + 3 = 12
(b) The students who obtained their marks below 4 are the students who obtained their marks as either of 1, 2, and 3.
Hence, number of these students = 2 + 3 + 3 = 8 Question 2
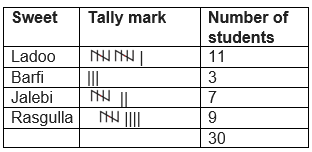
Following is the choice of sweets of 30 students of Class VI.
Ladoo, Barfi, Ladoo, Jalebi, Ladoo, Rasgulla, Jalebi, Ladoo, Barfi, Rasgulla, Ladoo,
Jalebi, Jalebi, Rasgulla, Ladoo, Rasgulla, Jalebi, Ladoo, Rasgulla, Ladoo, Ladoo,
Barfi, Rasgulla, Rasgulla, Jalebi, Rasgulla, Ladoo, Rasgulla, Jalebi, Ladoo.
(a) Arrange the names of sweets in a table using tally marks.
(b) Which sweet is preferred by most of the students? Answer
(a)
(b) we can see that highest number of students (11) preferred Ladoo
Question3
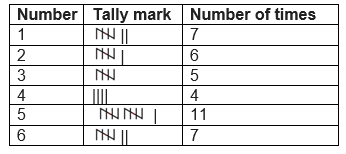
Catherine threw a dice 40 times and noted the number appearing each time as shown below:
1 3 5 6 6 3 5 4 1 6
2 5 3 4 6 1 5 5 6 1
1 2 2 3 5 2 4 5 5 6
5 1 6 2 3 5 2 4 1 5
Make a table and enter the data using tally marks. Find the number that appeared.
(a) The minimum number of times (b) The maximum number of times
(c) Find those numbers that appear an equal number of times Answer
(a) The number which appeared the minimum number of times (i.e., 4 times) is 4.
(b) The number which appeared the maximum number of times (i.e., 11 times) is 5.
(c) 1 and 6 are the numbers which appear for the same number of times (i.e., 7 times).
Question 4
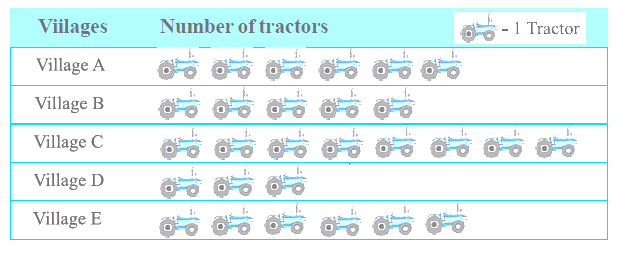
Following pictograph shows the number of tractors in five villages.
Observe the pictograph and answer the following questions.
(i) Which village has the minimum number of tractors?
(ii) Which village has the maximum number of tractors?
(iii) How many more tractors village C has as compared to village B.
(iv) What is the total number of tractors in all the five villages? Answer
(i) Village D has the minimum number of tractors, i.e., only 3 tractors.
(ii) Village C has the maximum number of tractors, i.e., 8 tractors.
(iii) village C tractors = 8
Village B tractors =5
So, number of tractors C as compared to B =8 − 5 = 3
(iv) Total number of tractors in all these villages = 6 + 5 + 8 + 3 + 6 = 28 Question 4
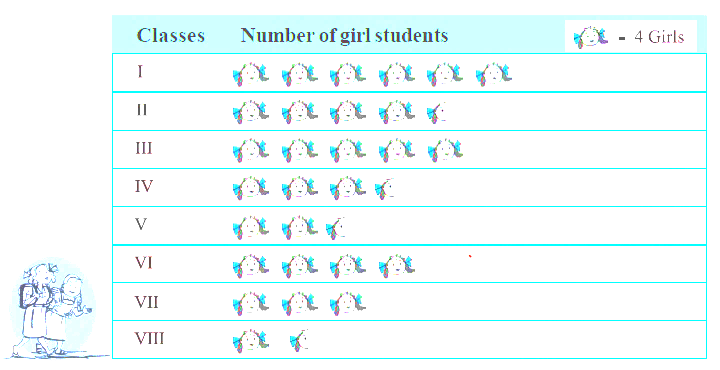
The number of girl students in each class of a co-educational middle school is depicted by the pictograph:
Observe this pictograph and answer the following questions:
(a) Which class has the minimum number of girl students?
(b) Is the number of girls in Class VI less than the number of girls in Class V?
(c) How many girls are there in Class VII? Answer
We observed from the table the number of girls in classes I, II, III, IV, V, VI, VII, VIII are 24, 18, 20, 14, 10, 16, 12, 6 girls respectively.
(a) Class VIII has the minimum number of girls, i.e., only 6 girls.
(b) In class V and VI, there are 10 and 16 girls respectively. Clearly, the number of girls is more in class VI than that in class V. So, answer is NO
(c) There are 12 girls in class VII.
Question 6
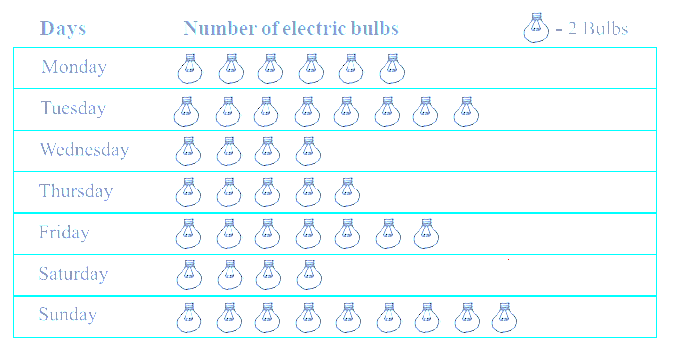
The sale of electric bulbs on different days of a week is shown below
Observe the pictograph and answer the following questions:
(a) How many bulbs were sold on Friday?
(b) On which day were the maximum number of bulbs sold?
(c) On which of the days same number of bulbs were sold?
(d) On which of the days minimum number of bulbs were sold?
(e) If one big carton can hold 9 bulbs. How many cartons were needed in the given week? Answer
It can be observed that Number of bulbs sold on Monday, Tuesday, Wednesday, Thursday, Friday, Saturday, and Sunday are 12, 16, 8, 10, 14, 8, and 18 respectively.
a) 14 bulbs were sold on Friday
(b) Clearly 18 is maximum in above numbers. So, the maximum numbers of bulbs (i.e., 18) were sold on Sunday.
(c) Equal numbers of bulbs (i.e., 8) were sold on Wednesday and Saturday.
(d) Clearly minimum is 8. So, the minimum numbers of bulbs (i.e., 8) were sold on Wednesday and Saturday.
(e) Now Total bulbs sold in the week = 12 + 16 + 8 + 10 + 14 + 8 + 18 = 86
So total cartoons needed = 86/9 = 10 Cartoons are required
Question 7
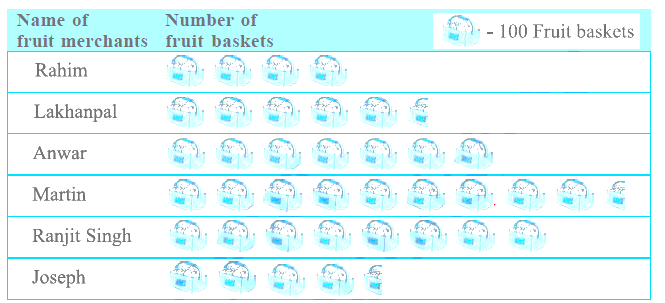
In a village six fruit merchants sold the following number of fruit baskets in a particular season:
Observe this pictograph and answer the following questions:
(a) Which merchant sold the maximum number of baskets?
(b) How many fruit baskets were sold by Anwar?
(c) The merchants who have sold 600 or more number of baskets are planning to buy a godown for the next season. Can you name them? Answer
it can be observed that the number of fruit baskets sold by Rahim, Lakhanpal, Anwar, Martin, Ranjit Singh, and Joseph are 400, 550, 700, 950, 800, and 450 respectively.
(a) Martin sold the maximum number of baskets, i.e., 950.
(b) Anwar sold 700 baskets.
(c) Anwar, Martin, and Ranjit Singh are the three merchants who have sold more than 600 baskets. Therefore, they are planning to buy a godown for the next season.
Exercise 9.2
Question 1
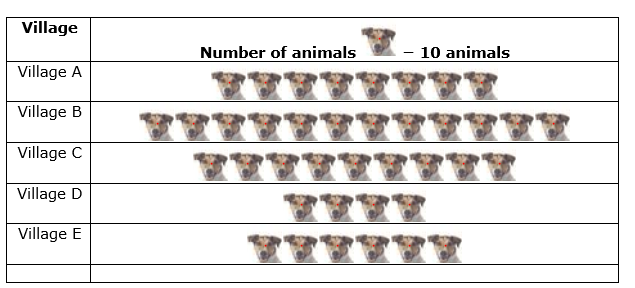
Total number of animals in five villages are as follows:
Village A: 80 Village B: 120
Village C: 90 Village D: 40
Village E: 60
Prepare a pictograph of these animals using one symbol to represent 10 animals
and answer the following questions:
(a) How many symbols represent animals of village E?
(b) Which village has the maximum number of animals?
(c) Which village has more animals: village A or village C? Answer
The pictograph for the given data can be drawn as follows.
(a) 6 symbols will represent animals of village E as there were 60 animals in this village.
(b) Village B has the maximum number of animals i.e., 120.
(c) Village A and C have 80 and 90 animals in it. Clearly, Village C has more animals.
Question 2
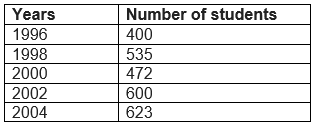
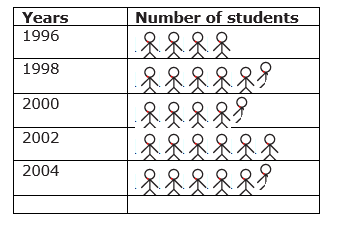
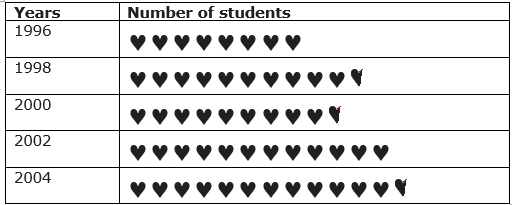
Total number of students of a school in different years is shown in the following table
A. Prepare a pictograph of students using one symbol to represent 100 students and
answer the following questions:
(a) How many symbols represent total number of students in the year 2002?
(b) How many symbols represent total number of students for the year 1998?
B. Prepare another pictograph of students using any other symbol each representing 50
students. Which pictograph do you find more informative? Answer
A)
(a) 6 symbols represent the total number of students in the year 2002.
(b) 5 complete and 1 incomplete symbols represent the total number of students in the year 1998. B) Second one is more informative
Exercise 9.3
Question 1
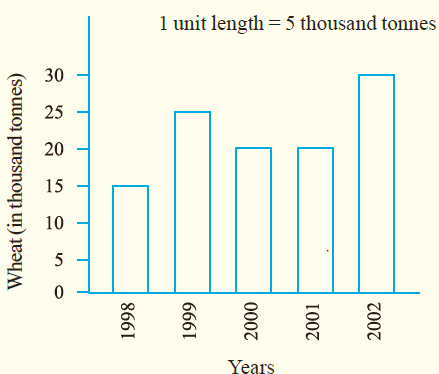
The bar graph given alongside shows the amount of wheat purchased by government during the year 1998-2002.
Read the bar graph and write down your observations. In which year was
(a) the wheat production maximum?
(b) the wheat production minimum?
Answer
(a) The wheat production was maximum in year 2002.
(b) The wheat production was minimum in year 1998.
Question 2
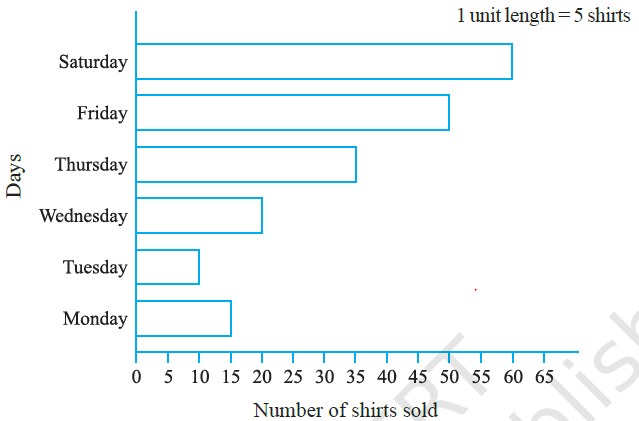
Observe this bar graph which is showing the sale of shirts in a readymade shop from Monday to Saturday.
Now answer the following questions:
(a) What information does the above bar graph give?
(b) What is the scale chosen on the horizontal line representing number of shirts?
(c) On which day were the maximum number of shirts sold? How many shirts were sold on that day?
(d) On which day were the minimum number of shirts sold?
(e) How many shirts were sold on Thursday? Answer
(a) This bar graph represents the number of shirts sold from Monday to Saturday.
(b) 1 unit = 5 shirts
(c) The number of shirts sold on Saturday was the maximum, i.e., 60
(d) The number of shirts sold on Tuesday was the minimum, i.e., 10
(e) Number of shirts sold on Thursday=35
Question 3
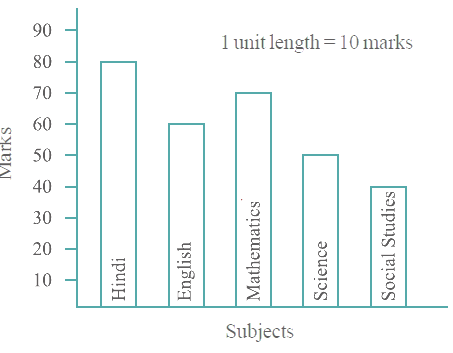
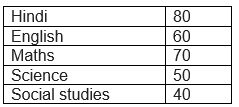
Observe this bar graph which shows the marks obtained by Aziz in half-yearly examination in different subjects.
Answer the given questions.
(a) What information does the bar graph give?
(b) Name the subject in which Aziz scored maximum marks.
(c) Name the subject in which he has scored minimum marks.
d) State the name of the subjects and marks obtained in each of them. Answer
(a) This graph shows the marks obtained by Aziz in different subjects.
(b) In Hindi, Aziz scored maximum marks i.e., 80.
(c) In Social studies, Aziz scored minimum marks i.e., 40.
(d)
Exercise 9.4
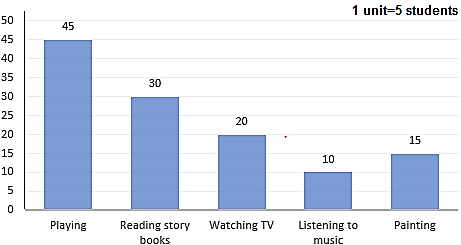
Question 1
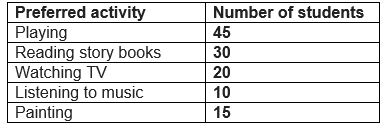
A survey of 120 school students was done to find which activity they prefer
to do in their free time.
Draw a bar graph to illustrate the above data taking scale of 1 unit
length = 5 students.
Which activity is preferred by most of the students other than playing? Answer
We can see that Reading story books is preferred by students other than playing
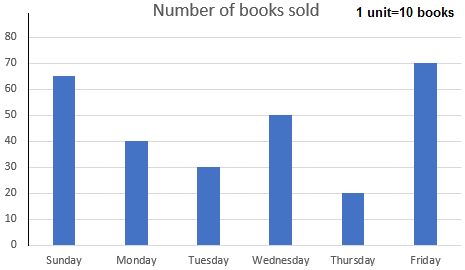
Question 2
The number of Mathematics books sold by a shopkeeper on six consecutive days is shown below:
Draw a bar graph to represent the above information choosing the scale of your choice. Answer
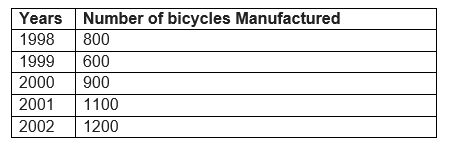
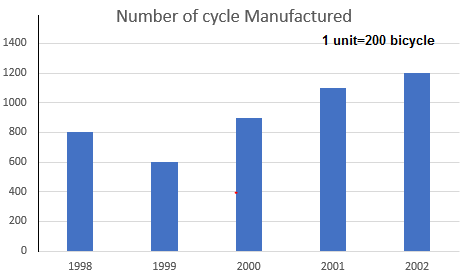
Question 3
Following table shows the number of bicycles manufactured in a factory during the years 1998 to 2002. Illustrate this data using a bar graph. Choose a scale of your choice.
(a) In which year were the maximum number of bicycles manufactured?
(b) In which year were the minimum number of bicycles manufactured? Answer
a) 2002
b) 1999
Question 4
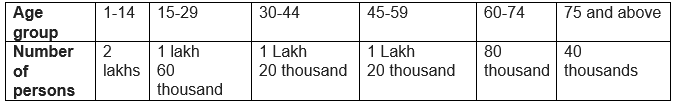
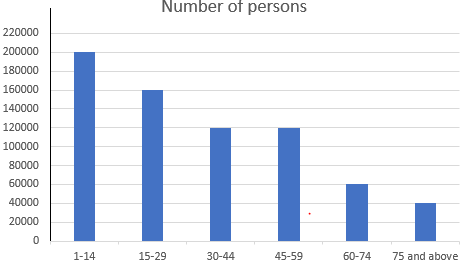
Number of persons in various age groups in a town is given in the following table.
Draw a bar graph to represent the above information and answer the following questions.
(take 1-unit length = 20 thousand)
(a) Which two age groups have same population?
(b) All persons in the age group of 60 and above are called senior citizens. How manysenior citizens are there in the town? Answer
a) 30-44 and 45-59 age group has same population
b) Senior citizen = population in 60-74 age group + population in 75 and above age group
=60000+40000
=100000