In this page we have introduction to graphs class 8 extra questions
. Hope you like them and do not forget to like , social share
and comment at the end of the page.
Question 1
The number of electric bulbs manufactured by a factory during five consecutive years is given below.
Years
2006
2007
2007
2008
2009
Number of Bulbs(lakh)
2
8.5
7.0
5
1
Draw the Line graph representing the above data. Question 2
Plot the points on a graph: P(4, 9) Q(6, 0) R(7, 7) S(2, 4)
Question 3
The number of students in Sandeep coaching institute during last 8 years is given below. Represent this data on the Line graph
Years
2001
2002
2003
2004
2005
2006
2007
Number of Students
100
120
95
130
85
160
100
Question 4 True and False Statement
(a) (5,0) lies on x-axis
(b) (0,1) lies on x-axis
(c) (0,0) is the origin
(d) (4,4) is equal distance from both the x-axis and y-axis Question 5
The number of trees planted by Government in different years is given below.
Year
2010
2011
2012
2013
2014
2015
Number of Trees to be Planted
150
220
350
400
300
380
Draw the line graph to represent the data.
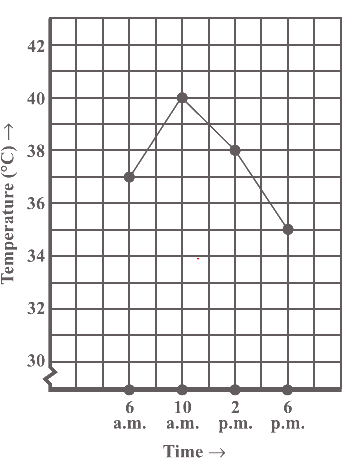
Question 6.
(a) what time temperature was maximum
(b) What is the temperature at 6 PM
(c) What is the temperature difference between time 6:00 AM and 6:00 PM
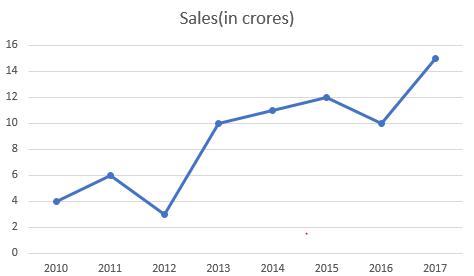
Question 7
Draw the points (1, 4) and (4, 1). Do they represent the same point? Question 8.
What were the sales in
(i) 2012
(ii) 2016
(iii)2007
(iv) 2014
(b) Compute the difference between the sales in 2012 and 2016.
(c) In which year was there the greatest difference between the sales as compared to its previous year? Question 9
The average monthly attendance of a class is given.
Month
July
Aug
Sep
Oct
Nov
Dec
Jan
Feb
Attendance
40
45
30
50
55
30
35
40
Draw the bar graph of the data given.
Question 10.
Draw the coordinates (2,2) , (2,4) and (4,2) And join these to form the triangle.
Summary
This introduction to graphs class 8 extra questions is prepared keeping in mind the latest syllabus of CBSE . This has been designed in a way to improve the academic performance of the students. If you find mistakes , please do provide the feedback on the mail. You can download this also using the below link