NCERT solutions for class 8 maths chapter 13 exercise 13.2
In this page we have NCERT solutions for class 8 maths chapter 13 exercise 13.2 for
Introduction to Graphs.This exercise has questions about application of linear graph and cartesian system. Hope you like them and do not forget to like , social share
and comment at the end of the page.
NCERT solutions for class 8 maths chapter 13 exercise 13.2
Question 1
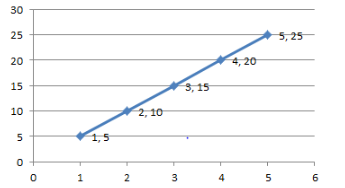
Draw the graphs for the following tables of values, with suitable scales on the axes.
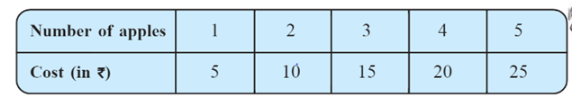
(a) Cost of apples
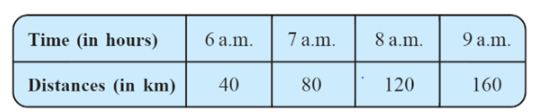
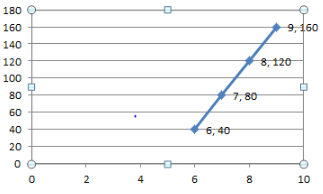
(b) Distance travelled by a car
(i) How much distance did the car cover during the period 7.30 a.m. to 8 a.m?
(ii) What was the time when the car had covered a distance of 100 km since it’s start?
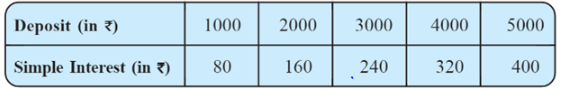
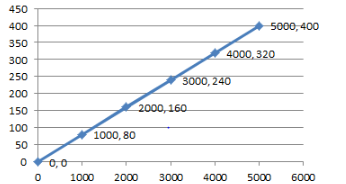
(c) Interest on deposits for a year.
(i) Does the graph pass through the origin?
(ii) Use the graph to find the interest on Rs 2500 for a year.
(iii) To get an interest of Rs 280 per year, how much money should be deposited? Answer
Steps to follow for Drawing the graph
1. Find the quantities to be plotted
2. Decide the quantities to betaken on x-axis and on y-axis.
3. Choose a scale.
4. Plot points.
5. Join the points
(a) We can mark number of apples on x-axis and cost of apples in y-axis
(b) We can mark timing on x-axis and distance covered in y-axis
(i)20 km
(ii) 7:30 AM
(c)
(i) Yes
(ii) The mid point between 2000 and 3000 is near Rs. 200, so the interest for Rs. 2500 is Rs. 200
(iii) From the graph, we can infer that Rs3500 deposit is required to earned Rs 280 interest
Question 2
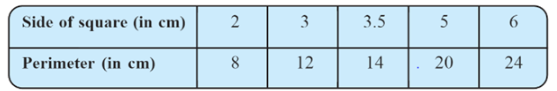
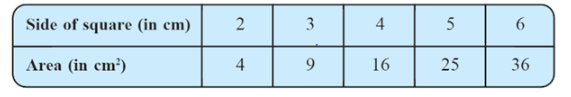
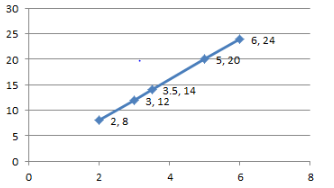
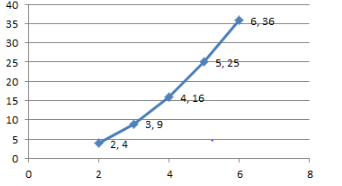
Draw a graph for the following. (i) (ii)
Answer (i) This is a linear graph (ii) This is not a linear graph as it is not straight line
Summary
NCERT solutions for class 8 maths chapter 13 exercise 13.2 has been prepared by Expert with utmost care. If you find any mistake.Please do provide feedback on mail. You can download the solutions as PDF in the below Link also Download Introduction to Graphs NCERT solution Exercise 13.2 as pdf
This chapter 13 has total 2 Exercise 13.1 ,13.2 as per latest syllabus. Exercise 15.3 is deleted as per latest syllabus. This is the second exercise in the chapter.You can explore previous exercise of this chapter by clicking the link below