In this page we have P-V Diagram Problems and Solutions on heat and thermodynamics for JEE and Competitive examinations . Hope you like them and do not forget to like , social share and comment at the end of the page.
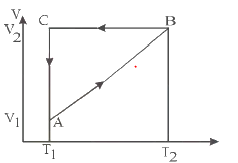
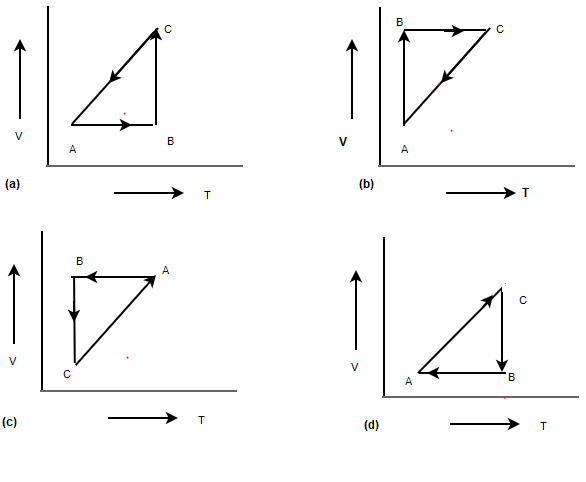
A straight line between A to B on V-T diagram indicates $V \alpha T$.So Pressure is constant.
Answer
Volume is constant from B-C .Now since temperature is decreasing, Pressure must decrease
Temperature is constant,So Isothermal process
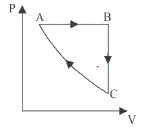
Heat Supplied to the engine in Process A to B
Answer
heat is being given to the surrounding in Process C to D
It depend on temperature only
Answer
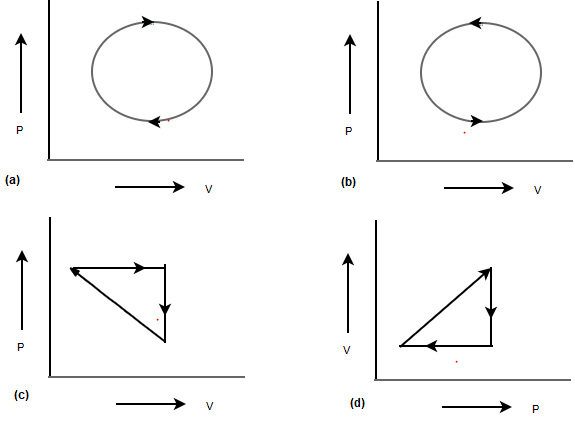
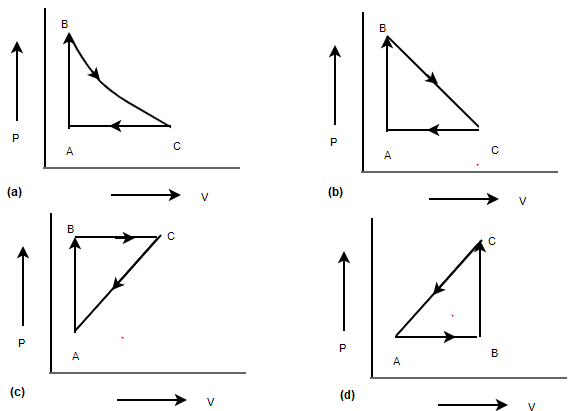
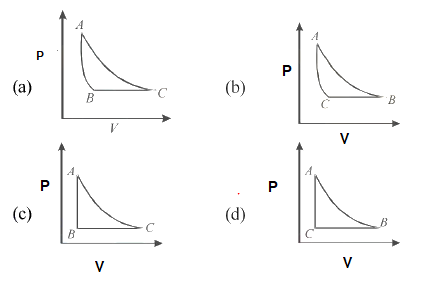
In a cyclic Process,heat is absorbed by a gas when the work done by it is positive. i.e Work done in the P-V diagram should be positive.
Answer
Now Work is done by the gas in a cyclic process in the P-V diagram ,if the process is clockwise and it is negative if it is anticlockwise.Here P is on Y-axis and V is on X-axis
Now if P is on x axis and V is on Y-axis, the work done is positive , it cycle moves anticlockwise and negative ,it is clockwise
Keeping the above in mind, option (a) and (c) are correct
Answer
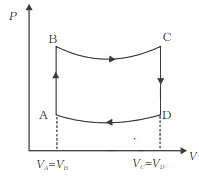
Since in cycle process total internal change is zero .
ΔU1 + ΔU2 + ΔU3 + ΔU4 = 0
3670 - 4800 - 1800 + ΔU4 = 0
ΔU4 = 2930 J
Now in Cycle
ΔW = ΔQ
= 5960 - 5600 - 3000 + 3600 = 960 J.
Hence answer is a
As temperature is constant ,internal energy will remain constant
Answer
$W=nRT ln \frac {V_2}{V_1}$
So ans is d
(a)
Answer
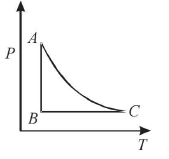
This can be easily solved with ideal Gas equation
$PV=nRT$
At constant T, P is inversely proportional to V .An isotherm Curve
At constant Pressure, Volume is directly proportional to T. An straight line
At constant volume, Pressure is directly proportional to T. An straight line
(a)
Answer
(b)
Answer
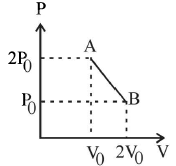
Equation of line will be
Answer
$P =mV +c$
Now putting boundary condition
$2P_0 =mV_0 +c$ -(1)
$P_0 =m(2V_0) +c$ -(2)
Solving (1) and (2)
$m= -\frac {P_0}{V_0}$
$c=3P_0$
So equation is
$P =(-\frac {P_0}{V_0}) V + 3P_0$ --(3)
or
$PV_0 = -P_0 V + 3P_0V_0$
Now PV=nRT or $P =\frac {nRT}{V}$
Therefore,
$\frac {nRT}{V} V_0=-P_0 V + 3P_0V_0$
$nRTV_0 = -P_0v^2 + 3P_0V_0 V$
Differentiating with respect to V
$nRV_0 \frac {dT}{dV} = -2P_0V + 3P_0V_0$
Now T will be maximum ,when
$\frac {dT}{dV}= 0$
Therefore $V= \frac {3V_0}{2}$
From (3) , $P= \frac {3P_0}{2}$
Therefore from $PV=nRT$
$T_{max}=\frac {9P_0V_0}{4nR}$
(c) as internal energy is a state variable
Answer
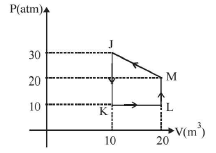
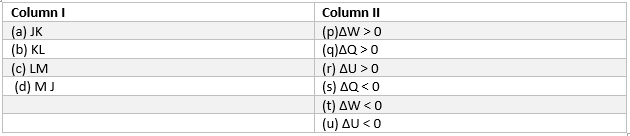
JK -> Here Volume is constant so,$\Delta W=0$, Hence $\Delta Q= \Delta U$ , Now since $p \alpha T$, Pressure has decrease,So temperature will decrease .So both $\Delta Q < 0$ and $\Delta U < 0$ . So option (s) and (u)
Answer
KL -> Here pressure is constant and volume is increasing , $\Delta W > 0$. Also as Volume is increasing ,temp will increase, So $\Delta U > 0$, Therefore $\Delta Q > 0$. So option (p),(q) and (r)
LM -> Here Volume is constant so,$\Delta W=0$, Hence $\Delta Q= \Delta U$ , Now since $p \alpha T$, Pressure has increase,So temperature will increase .So both $\Delta Q > 0$ and $\Delta U > 0$ . So option (q) and (r)
MJ -> Here since Volume decrease, $\Delta W < 0$, Also we can see that final temperature decrease, $\Delta U < 0$, hence $\Delta Q < 0$.So option (s) ,(t) and (u)
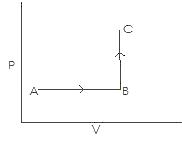
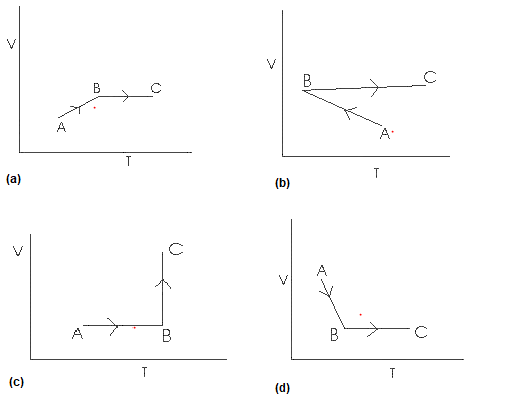
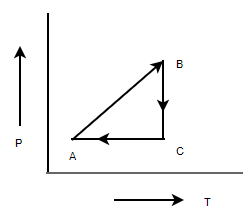
In A to B process
Answer
P =constant
so PV = nRT
V is proportional to T
so volume should increase with temp.
In B to C
V = Constant
PV = nRT
P is proportional to T
So pressure increase, temperature increases