Solved Example of PV diagram
Question 1
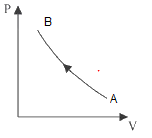
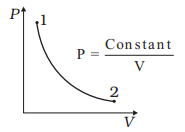
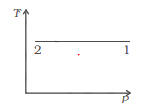
Consider P-V diagram for an ideal gas
Draw the corresponding T-P diagram
Solution
here
$P= \frac {constant}{V}$
or
$PV= constant$
So it means temperature is constant.So here is the TP diagram
 Question 2
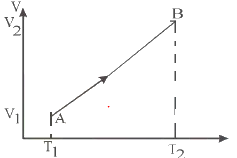
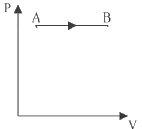
Draw the corresponding P-V diagram for the given T-V diagram
 Solution
Since TV diagram is a straight line
T/V =constant
it means Pressure is constant
 Question 3
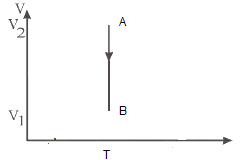
Draw the corresponding P-V diagram for the given T-V diagram
 Solution
Since T is constant
PV diagram should be isotherm